Trupanion Reports Second Quarter 2025 Results
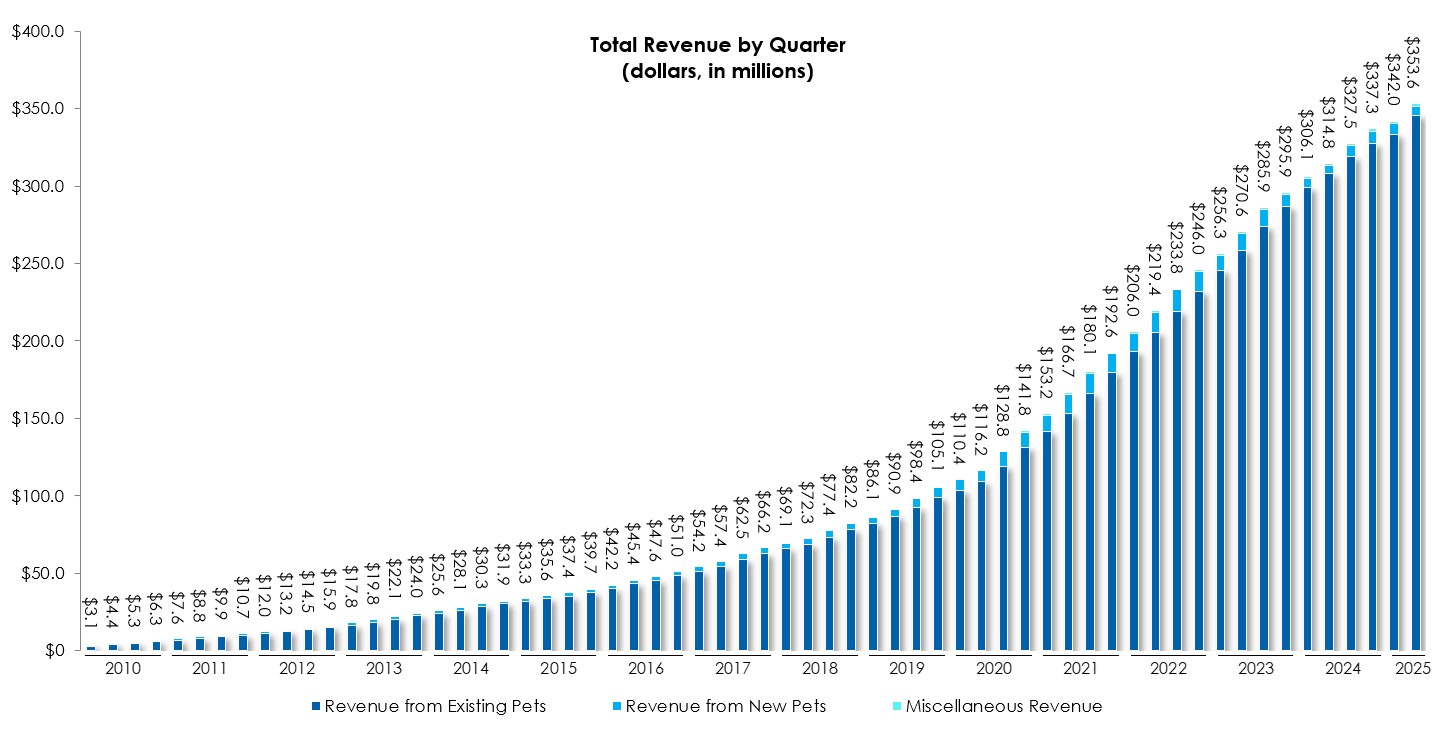
Trupanion (Nasdaq: TRUP), a leading pet medical insurance provider, reported strong Q2 2025 financial results. The company achieved total revenue of $353.6 million, up 12% year-over-year, with subscription business revenue increasing 16% to $242.2 million.
The company reported net income of $9.4 million ($0.22 per share), compared to a net loss of $5.9 million in Q2 2024, including a $7.8 million gain from a preferred stock exchange. Total enrolled pets reached 1.66 million, with subscription pets growing 4% to 1.07 million. Operating cash flow strengthened to $15.0 million, with free cash flow of $12.0 million.
Trupanion (Nasdaq: TRUP), un importante fornitore di assicurazioni mediche per animali domestici, ha riportato solidi risultati finanziari nel secondo trimestre del 2025. L'azienda ha raggiunto un fatturato totale di 353,6 milioni di dollari, in crescita del 12% rispetto all'anno precedente, con i ricavi derivanti dagli abbonamenti aumentati del 16%, raggiungendo 242,2 milioni di dollari.
L'azienda ha registrato un utile netto di 9,4 milioni di dollari (0,22 dollari per azione), rispetto a una perdita netta di 5,9 milioni nel secondo trimestre del 2024, includendo un guadagno di 7,8 milioni di dollari derivante da uno scambio di azioni privilegiate. Il numero totale di animali iscritti ha raggiunto 1,66 milioni, con gli animali in abbonamento cresciuti del 4%, arrivando a 1,07 milioni. Il flusso di cassa operativo si è rafforzato a 15,0 milioni di dollari, con un flusso di cassa libero di 12,0 milioni.
Trupanion (Nasdaq: TRUP), un proveedor líder de seguros médicos para mascotas, reportó sólidos resultados financieros en el segundo trimestre de 2025. La compañía alcanzó unos ingresos totales de 353,6 millones de dólares, un aumento del 12% interanual, con ingresos por suscripciones incrementándose un 16% hasta 242,2 millones de dólares.
La empresa informó un ingreso neto de 9,4 millones de dólares (0,22 dólares por acción), en comparación con una pérdida neta de 5,9 millones en el segundo trimestre de 2024, incluyendo una ganancia de 7,8 millones de dólares proveniente de un intercambio de acciones preferentes. El total de mascotas inscritas alcanzó 1,66 millones, con mascotas en suscripción creciendo un 4% hasta 1,07 millones. El flujo de caja operativo se fortaleció a 15,0 millones de dólares, con un flujo de caja libre de 12,0 millones.
Trupanion (나스��: TRUP)은 선도적인 반려동물 의료 보험 제공업체로서 2025�� 2분기�� 견고�� 재무 실적�� 보고했습니다. ��사��� �� 매출 3�� 5,360�� 달러�� 기록하며 전년 대�� 12% 증가했으��, 구독 사업 매출은 16% 증가�� 2�� 4,220�� 달러�� 기록했습니다.
��사��� 순이�� 940�� 달러(주당 0.22달러)�� 보고했으��, 이는 2024�� 2분기 590�� 달러 순손실에�� 크게 개선�� 수치입니��. 여기에는 우선�� 교환에서 발생�� 780�� 달러�� 이익�� 포함되어 있습니다. �� 등록�� 반려동물 수는 166�� 마리�� 달하��, 구독 반려동물은 4% 증가�� 107�� 마리입니��. 영업 현금 흐름은 1,500�� 달러�� 강화되었��, 자유 현금 흐름은 1,200�� 달러입니��.
Trupanion (Nasdaq : TRUP), un fournisseur leader d'assurance médicale pour animaux de compagnie, a annoncé de solides résultats financiers pour le deuxième trimestre 2025. La société a réalisé un chiffre d'affaires total de 353,6 millions de dollars, en hausse de 12 % par rapport à l'année précédente, avec des revenus d'abonnement en hausse de 16 % pour atteindre 242,2 millions de dollars.
La société a déclaré un bénéfice net de 9,4 millions de dollars (0,22 dollar par action), contre une perte nette de 5,9 millions au deuxième trimestre 2024, incluant un gain de 7,8 millions de dollars provenant d'un échange d'actions privilégiées. Le nombre total d'animaux inscrits a atteint 1,66 million, avec une croissance de 4 % des animaux en abonnement, atteignant 1,07 million. Les flux de trésorerie d'exploitation se sont renforcés à 15,0 millions de dollars, avec un flux de trésorerie libre de 12,0 millions.
Trupanion (Nasdaq: TRUP), ein führender Anbieter von Tierkrankenversicherungen, meldete starke Finanzergebnisse für das 2. Quartal 2025. Das Unternehmen erzielte einen Gesamtumsatz von 353,6 Millionen US-Dollar, ein Anstieg von 12 % im Jahresvergleich, wobei die Einnahmen aus dem Abonnementgeschäft um 16 % auf 242,2 Millionen US-Dollar stiegen.
Das Unternehmen meldete einen Nettoertrag von 9,4 Millionen US-Dollar (0,22 US-Dollar pro Aktie) im Vergleich zu einem Nettoverlust von 5,9 Millionen US-Dollar im 2. Quartal 2024, einschließlich eines Gewinns von 7,8 Millionen US-Dollar aus einem Vorzugsaktientausch. Die Gesamtzahl der angemeldeten Haustiere erreichte 1,66 Millionen, wobei die Abonnement-Tiere um 4 % auf 1,07 Millionen wuchsen. Der operative Cashflow verbesserte sich auf 15,0 Millionen US-Dollar, mit einem freien Cashflow von 12,0 Millionen.
- Turned profitable with net income of $9.4 million vs $5.9 million loss year-over-year
- Subscription business revenue grew 16% to $242.2 million
- Adjusted EBITDA more than doubled to $16.6 million from $7.4 million
- Operating cash flow increased to $15.0 million from $6.9 million year-over-year
- Strong liquidity position with $319.6 million in cash and investments
- Total enrolled pets decreased 2% year-over-year
- Subscription enrolled pets growth slowed to 4%
- Net income includes one-time gain of $7.8 million from preferred stock exchange
Insights
Trupanion posted strong Q2 2025 results with 12% revenue growth and shift to profitability, despite mixed pet enrollment trends.
Trupanion delivered a remarkably strong financial quarter with significant improvements across several key metrics. Revenue reached
While the headline numbers look positive, it's worth noting that
The enrollment metrics present a mixed picture. Total enrolled pets decreased
Cash generation shows remarkable improvement, with operating cash flow more than doubling to
The CEO's reference to "strengthening retention" alongside the financial improvements suggests the company is not just growing revenue but doing so with better customer economics. The combination of accelerating subscription revenue growth, margin expansion, improved retention, and positive cash flow represents a significant inflection point for Trupanion's business model.
SEATTLE, Aug. 07, 2025 (GLOBE NEWSWIRE) -- Trupanion, Inc. (Nasdaq: TRUP), the leading provider of medical insurance for cats and dogs, today announced financial results for the second quarter ended June 30, 2025.
“The second quarter was one of the strongest financial quarters in our history, marked by consistent top-line growth, robust margin expansion and strengthening retention,�� said Margi Tooth, Chief Executive Officer and President of Trupanion. “These results create a strong foundation to invest in this globally underpenetrated market and bring the benefits of Trupanion to more pets and pet parents.��
Second Quarter 2025 Financial and Business Highlights
- Total revenue was
$353.6 million , an increase of12% compared to the second quarter of 2024. - Total enrolled pets (including pets from our other business segment) was 1,660,455 at June 30, 2025, a decrease of
2% over June 30, 2024. - Subscription business revenue was
$242.2 million , an increase of16% compared to the second quarter of 2024. - Subscription enrolled pets was 1,066,354 at June 30, 2025, an increase of
4% over June 30, 2024. - Net income was
$9.4 million , or$0.22 per basic and diluted share, compared to net loss of$(5.9) million , or$(0.14) per basic and diluted share, in the second quarter of 2024. Net income included a realized gain of$7.8 million from the exchange of a preferred stock investment for intellectual property in the second quarter of 2025. - Adjusted EBITDA was
$16.6 million , compared to adjusted EBITDA of$7.4 million in the second quarter of 2024. - Operating cash flow was
$15.0 million and free cash flow was$12.0 million in the second quarter of 2025. This compared to operating cash flow of$6.9 million and free cash flow of$4.0 million in the second quarter of 2024.
First Half 2025 Financial and Business Highlights
- Total revenue was
$695.5 million , an increase of12% compared to the first half of 2024. - Subscription business revenue was
$475.2 million , an increase of16% compared to the first half of 2024. - Net income was
$7.9 million , or$0.19 per basic and$0.18 per diluted share, compared to net loss of$(12.7) million , or$(0.30) per basic and diluted share, in the first half of 2024. Net income included a realized gain of$7.8 million from the exchange of a preferred stock investment for intellectual property in the first half of 2025. - Adjusted EBITDA was
$28.8 million , compared to adjusted EBITDA of$12.2 million in the first half of 2024. - Operating cash flow was
$31.0 million and free cash flow was$26.1 million in the first half of 2025. This compared to operating cash flow of$9.3 million and free cash flow of$3.3 million in the first half of 2024. - At June 30, 2025, the Company held
$319.6 million in cash and short-term investments, including$53.3 million held outside the insurance entities, with an additional$15 million available under its credit facility.
Conference Call
Trupanion’s management will host a conference call today to review its second quarter 2025 results. The call is scheduled to begin shortly after 1:30 p.m. PT/ 4:30 p.m. ET. A live webcast will be accessible through the Investor Relations section of Trupanion’s website at ��and will be archived online for 3 months upon completion of the conference call. Participants can access the conference call by dialing 1-844-676-1342 (United States) or 1-412-634-6683 (International). A telephonic replay of the call will also be available after the completion of the call, by dialing 1-844-512-2921 (United States) or 1-412-317-6671 (International) and entering the replay pin number: 10200168.
About Trupanion
Trupanion is a leader in medical insurance for cats and dogs throughout the United States, Canada, and certain countries in Continental Europe with over 1,000,000 pets currently enrolled. For over two decades, Trupanion has given pet owners peace of mind so they can focus on their pet's recovery, not financial stress. Trupanion is committed to providing pet parents with the highest value in pet medical insurance with unlimited payouts for the life of their pets. With its patented process, Trupanion is the only North American provider with the technology to pay veterinarians directly in seconds at the time of checkout. Trupanion is listed on NASDAQ under the symbol "TRUP". The company was founded in 2000 and is headquartered in Seattle, WA. Trupanion policies are issued, in the United States, by its wholly owned insurance entity American Pet Insurance Company and, in Canada, by Accelerant Insurance Company of Canada or GPIC Insurance Company. Policies are sold and administered in Canada by Canada Pet Health Insurance Services, Inc. dba Trupanion 309-1277 Lynn Valley Road, North Vancouver, BC V7J 0A2 and in the United States by Trupanion Managers USA, Inc. (CA license No. 0G22803, NPN 9588590). Canada Pet Health Insurance Services, Inc. is a registered damage insurance agency and claims adjuster in Quebec #603927. For more information, please visit trupanion.com.
Forward-Looking Statements
This press release contains forward-looking statements within the meaning of Section 27A of the Securities Act of 1933 and Section 21E of the Securities Exchange Act of 1934 relating to, among other things, expectations, plans, prospects and financial results for Trupanion, including, but not limited to, its expectations regarding its ability to continue to grow its enrollments and revenue, and otherwise execute its business plan. These forward-looking statements are based upon the current expectations and beliefs of Trupanion’s management as of the date of this press release, and are subject to certain risks and uncertainties that could cause actual results to differ materially from those described in the forward-looking statements. All forward-looking statements made in this press release are based on information available to Trupanion as of the date hereof, and Trupanion has no obligation to update these forward-looking statements.
In particular, the following factors, among others, could cause results to differ materially from those expressed or implied by such forward-looking statements: the ability to achieve or maintain profitability and/or appropriate levels of cash flow in future periods; the ability to keep growing our membership base and revenue; the accuracy of assumptions used in determining appropriate member acquisition expenditures; the severity and frequency of claims; the ability to maintain high retention rates; the accuracy of assumptions used in pricing medical plan subscriptions and the ability to accurately estimate the impact of new products or offerings on claims frequency; actual claims expense exceeding estimates; regulatory and other constraints on the ability to institute, or the decision to otherwise delay, pricing modifications in response to changes in actual or estimated claims expense; the effectiveness and statutory or regulatory compliance of our Territory Partner model and of our Territory Partners, veterinarians and other third parties in recommending medical plan subscriptions to potential members; the ability to retain existing Territory Partners and increase the number of Territory Partners and active hospitals; compliance by us and those referring us members with laws and regulations that apply to our business, including the sale of a pet medical plan; the ability to maintain the security of our data; fluctuations in the Canadian currency exchange rate; the ability to protect our proprietary and member information; the ability to maintain our culture and team; the ability to maintain the requisite amount of risk-based capital; our ability to implement and maintain effective controls, including to remediate material weaknesses in internal controls over financial reporting; the ability to protect and enforce Trupanion’s intellectual property rights; the ability to successfully implement our alliance with Aflac; the ability to continue key contractual relationships with third parties; third-party claims including litigation and regulatory actions; the ability to recognize benefits from investments in new solutions and enhancements to Trupanion’s technology platform and website; our ability to retain key personnel; and deliberations and determinations by the Trupanion board based on the future performance of the company or otherwise.
For a detailed discussion of these and other cautionary statements, please refer to the risk factors discussed in filings with the Securities and Exchange Commission (SEC), including but not limited to, Trupanion’s Annual Report on Form 10-K for the year ended December 31, 2024 and any subsequently filed reports on Forms 10-Q, 10-K and 8-K. All documents are available through the SEC’s Electronic Data Gathering Analysis and Retrieval system at ��or the Investor Relations section of Trupanion’s website at .
Non-GAAP Financial Measures
Trupanion’s stated results may include certain non-GAAP financial measures. These non-GAAP financial measures may not provide information that is directly comparable to that provided by other companies in its industry as other companies in its industry may calculate or use non-GAAP financial measures differently. In addition, there are limitations in using non-GAAP financial measures because the non-GAAP financial measures are not prepared in accordance with GAAP, may be different from non-GAAP financial measures used by other companies and exclude expenses that may have a material impact on Trupanion’s reported financial results. The presentation and utilization of non-GAAP financial measures is not meant to be considered in isolation or as a substitute for the directly comparable financial measures prepared in accordance with GAAP. Trupanion urges its investors to review the reconciliation of its non-GAAP financial measures to the most directly comparable GAAP financial measures in its consolidated financial statements, and not to rely on any single financial or operating measure to evaluate its business. These reconciliations are included below and on Trupanion’s Investor Relations website.
Because of varying available valuation methodologies, subjective assumptions and the variety of equity instruments that can impact a company’s non-cash expenses, Trupanion believes that providing various non-GAAP financial measures that exclude stock-based compensation expense and depreciation and amortization expense allows for more meaningful comparisons between its operating results from period to period. Trupanion offsets new pet acquisition expense with sign-up fee revenue in the calculation of net acquisition cost because it collects sign-up fee revenue from new members at the time of enrollment and considers it to be an offset to a portion of Trupanion’s new pet acquisition expense. Trupanion believes this allows it to calculate and present financial measures in a consistent manner across periods. Trupanion’s management believes that the non-GAAP financial measures and the related financial measures derived from them are important tools for financial and operational decision-making and for evaluating operating results over different periods of time.
| Trupanion, Inc. Condensed Consolidated Statements of Operations (in thousands, except share data) | |||||||||||||||
| �� | |||||||||||||||
| �� | Three Months Ended June 30, | �� | Six Months Ended June 30, | ||||||||||||
| �� | �� | 2025 | �� | �� | �� | 2024 | �� | �� | �� | 2025 | �� | �� | �� | 2024 | �� |
| �� | (unaudited) | ||||||||||||||
| Revenue: | �� | �� | �� | �� | �� | �� | �� | ||||||||
| Subscription business | $ | 242,156 | �� | �� | $ | 208,618 | �� | �� | $ | 475,220 | �� | �� | $ | 409,752 | �� |
| Other business | �� | 111,401 | �� | �� | �� | 106,182 | �� | �� | �� | 220,312 | �� | �� | �� | 211,169 | �� |
| Total revenue | �� | 353,557 | �� | �� | �� | 314,800 | �� | �� | �� | 695,532 | �� | �� | �� | 620,921 | �� |
| Cost of revenue: | �� | �� | �� | �� | �� | �� | �� | ||||||||
| Subscription business | �� | 195,488 | �� | �� | �� | 175,740 | �� | �� | �� | 385,333 | �� | �� | �� | 347,871 | �� |
| Other business | �� | 103,242 | �� | �� | �� | 98,791 | �� | �� | �� | 204,269 | �� | �� | �� | 196,554 | �� |
| Total cost of revenue(1), (2) | �� | 298,730 | �� | �� | �� | 274,531 | �� | �� | �� | 589,602 | �� | �� | �� | 544,425 | �� |
| Operating expenses: | �� | �� | �� | �� | �� | �� | �� | ||||||||
| Technology and development(1) | �� | 8,586 | �� | �� | �� | 8,190 | �� | �� | �� | 16,658 | �� | �� | �� | 15,150 | �� |
| General and administrative(1) | �� | 20,122 | �� | �� | �� | 15,253 | �� | �� | �� | 40,014 | �� | �� | �� | 29,926 | �� |
| New pet acquisition expense(1) | �� | 19,843 | �� | �� | �� | 17,874 | �� | �� | �� | 40,359 | �� | �� | �� | 34,717 | �� |
| Depreciation and amortization | �� | 3,962 | �� | �� | �� | 4,376 | �� | �� | �� | 7,753 | �� | �� | �� | 8,161 | �� |
| Total operating expenses | �� | 52,513 | �� | �� | �� | 45,693 | �� | �� | �� | 104,784 | �� | �� | �� | 87,954 | �� |
| Loss from investment in joint venture | �� | �� | �� | �� | �� | (47 | ) | �� | �� | (305 | ) | �� | �� | (150 | ) |
| Operating income (loss) | �� | 2,314 | �� | �� | �� | (5,471 | ) | �� | �� | 841 | �� | �� | �� | (11,608 | ) |
| Interest expense | �� | 3,682 | �� | �� | �� | 3,655 | �� | �� | �� | 6,893 | �� | �� | �� | 7,251 | �� |
| Other (income), net | �� | (11,914 | ) | �� | �� | (3,220 | ) | �� | �� | (15,154 | ) | �� | �� | (6,063 | ) |
| Income (loss) before income taxes | �� | 10,546 | �� | �� | �� | (5,906 | ) | �� | �� | 9,102 | �� | �� | �� | (12,796 | ) |
| Income tax (benefit) expense | �� | 1,133 | �� | �� | �� | (44 | ) | �� | �� | 1,172 | �� | �� | �� | (82 | ) |
| Net income (loss) | $ | 9,413 | �� | �� | $ | (5,862 | ) | �� | $ | 7,930 | �� | �� | $ | (12,714 | ) |
| �� | �� | �� | �� | �� | �� | �� | �� | ||||||||
| Net income (loss) per share: | �� | �� | �� | �� | �� | �� | �� | ||||||||
| Basic | $ | 0.22 | �� | �� | $ | (0.14 | ) | �� | $ | 0.19 | �� | �� | $ | (0.30 | ) |
| Diluted | $ | 0.22 | �� | �� | $ | (0.14 | ) | �� | $ | 0.18 | �� | �� | $ | (0.30 | ) |
| Weighted average shares of common stock outstanding: | �� | �� | �� | �� | �� | �� | �� | ||||||||
| Basic | �� | 42,872,153 | �� | �� | �� | 42,078,271 | �� | �� | �� | 42,734,426 | �� | �� | �� | 41,997,683 | �� |
| Diluted | �� | 43,325,704 | �� | �� | �� | 42,078,271 | �� | �� | �� | 43,544,325 | �� | �� | �� | 41,997,683 | �� |
| �� | �� | �� | �� | �� | �� | �� | �� | ||||||||
| (1)Includes stock-based compensation expense as follows: | Three Months Ended June 30, | �� | Six Months Ended June 30, | ||||||||||||
| �� | |||||||||||||||
| �� | �� | 2025 | �� | �� | �� | 2024 | �� | �� | �� | 2025 | �� | �� | �� | 2024 | �� |
| Veterinary invoice expense | $ | 774 | �� | �� | $ | 854 | �� | �� | $ | 1,544 | �� | �� | $ | 1,778 | �� |
| Other cost of revenue | �� | 605 | �� | �� | �� | 541 | �� | �� | �� | 1,094 | �� | �� | �� | 1,007 | �� |
| Technology and development | �� | 1,470 | �� | �� | �� | 1,261 | �� | �� | �� | 2,621 | �� | �� | �� | 2,515 | �� |
| General and administrative | �� | 5,047 | �� | �� | �� | 3,861 | �� | �� | �� | 9,575 | �� | �� | �� | 7,310 | �� |
| New pet acquisition expense | �� | 1,560 | �� | �� | �� | 2,129 | �� | �� | �� | 4,452 | �� | �� | �� | 4,188 | �� |
| Total stock-based compensation expense | $ | 9,456 | �� | �� | $ | 8,646 | �� | �� | $ | 19,286 | �� | �� | $ | 16,798 | �� |
| �� | �� | �� | �� | �� | �� | �� | �� | ||||||||
| (2)The breakout of cost of revenue between veterinary invoice expense and other cost of revenue is as follows: | |||||||||||||||
| �� | Three Months Ended June 30, | �� | Six Months Ended June 30, | ||||||||||||
| �� | �� | 2025 | �� | �� | �� | 2024 | �� | �� | �� | 2025 | �� | �� | �� | 2024 | �� |
| Veterinary invoice expense | $ | 255,580 | �� | �� | $ | 231,102 | �� | �� | $ | 503,030 | �� | �� | $ | 464,671 | �� |
| Other cost of revenue | �� | 43,150 | �� | �� | �� | 43,429 | �� | �� | �� | 86,572 | �� | �� | �� | 79,754 | �� |
| Total cost of revenue | $ | 298,730 | �� | �� | $ | 274,531 | �� | �� | $ | 589,602 | �� | �� | $ | 544,425 | �� |
| �� | �� | �� | �� | �� | �� | �� | �� | �� | �� | �� | �� | �� | �� | �� | �� |
| Trupanion, Inc. Condensed Consolidated Balance Sheets (in thousands, except share data) | |||||||
| �� | |||||||
| �� | June 30, 2025 | �� | December 31, 2024 | ||||
| �� | (unaudited) | �� | �� | ||||
| Assets | �� | �� | �� | ||||
| Current assets: | �� | �� | �� | ||||
| Cash and cash equivalents | $ | 122,742 | �� | �� | $ | 160,295 | �� |
| Short-term investments | �� | 196,854 | �� | �� | �� | 147,089 | �� |
| Accounts and other receivables, net of allowance for doubtful accounts of | �� | 292,820 | �� | �� | �� | 274,031 | �� |
| Prepaid expenses and other assets | �� | 16,665 | �� | �� | �� | 15,912 | �� |
| Total current assets | �� | 629,081 | �� | �� | �� | 597,327 | �� |
| Restricted cash | �� | 41,729 | �� | �� | �� | 39,235 | �� |
| Long-term investments | �� | 167 | �� | �� | �� | 373 | �� |
| Property, equipment, and internal-use software, net | �� | 101,785 | �� | �� | �� | 102,191 | �� |
| Intangible assets, net | �� | 26,134 | �� | �� | �� | 13,177 | �� |
| Other long-term assets | �� | 7,904 | �� | �� | �� | 17,579 | �� |
| Goodwill | �� | 40,989 | �� | �� | �� | 36,971 | �� |
| Total assets | $ | 847,789 | �� | �� | $ | 806,853 | �� |
| Liabilities and stockholders�� equity | �� | �� | �� | ||||
| Current liabilities: | �� | �� | �� | ||||
| Accounts payable | $ | 8,670 | �� | �� | $ | 11,532 | �� |
| Accrued liabilities and other current liabilities | �� | 37,629 | �� | �� | �� | 33,469 | �� |
| Reserve for veterinary invoices | �� | 52,523 | �� | �� | �� | 51,635 | �� |
| Deferred revenue | �� | 272,120 | �� | �� | �� | 251,640 | �� |
| Long-term debt - current portion | �� | 1,350 | �� | �� | �� | 1,350 | �� |
| Total current liabilities | �� | 372,292 | �� | �� | �� | 349,626 | �� |
| Long-term debt | �� | 113,116 | �� | �� | �� | 127,537 | �� |
| Deferred tax liabilities | �� | 2,007 | �� | �� | �� | 1,946 | �� |
| Other liabilities | �� | 4,920 | �� | �� | �� | 4,476 | �� |
| Total liabilities | �� | 492,335 | �� | �� | �� | 483,585 | �� |
| Stockholders�� equity: | �� | �� | �� | ||||
| Common stock: | �� | �� | �� | �� | �� | �� | �� |
| Preferred stock: | �� | �� | �� | �� | �� | �� | �� |
| Additional paid-in capital | �� | 587,289 | �� | �� | �� | 568,302 | �� |
| Accumulated other comprehensive income (loss) | �� | 2,657 | �� | �� | �� | (2,612 | ) |
| Accumulated deficit | �� | (217,958 | ) | �� | �� | (225,888 | ) |
| Treasury stock, at cost: 1,028,186 shares at June 30, 2025 and December��31, 2024 | �� | (16,534 | ) | �� | �� | (16,534 | ) |
| Total stockholders�� equity | �� | 355,454 | �� | �� | �� | 323,268 | �� |
| Total liabilities and stockholders�� equity | $ | 847,789 | �� | �� | $ | 806,853 | �� |
| �� | |||||||
| Trupanion, Inc. Condensed Consolidated Statements of Cash Flows (in thousands) | |||||||||||||||
| �� | |||||||||||||||
| �� | Three Months Ended June 30, | �� | Six Months Ended June 30, | ||||||||||||
| �� | �� | 2025 | �� | �� | �� | 2024 | �� | �� | �� | 2025 | �� | �� | �� | 2024 | �� |
| �� | (unaudited) | ||||||||||||||
| Operating activities | �� | �� | �� | �� | �� | �� | �� | ||||||||
| Net income (loss) | $ | 9,413 | �� | �� | $ | (5,862 | ) | �� | $ | 7,930 | �� | �� | $ | (12,714 | ) |
| Adjustments to reconcile net income (loss) to cash provided by operating activities: | �� | �� | �� | �� | �� | �� | �� | ||||||||
| Depreciation and amortization | �� | 3,962 | �� | �� | �� | 4,376 | �� | �� | �� | 7,753 | �� | �� | �� | 8,161 | �� |
| Stock-based compensation expense | �� | 9,456 | �� | �� | �� | 8,646 | �� | �� | �� | 19,286 | �� | �� | �� | 16,798 | �� |
| AG���˹ٷ�ized gain on nonmonetary exchange of preferred stock investment | �� | (7,783 | ) | �� | �� | �� | �� | �� | �� | (7,783 | ) | �� | �� | �� | �� |
| Other, net | �� | 601 | �� | �� | �� | (116 | ) | �� | �� | 951 | �� | �� | �� | (318 | ) |
| Changes in operating assets and liabilities: | �� | �� | �� | �� | �� | �� | �� | ||||||||
| Accounts and other receivables | �� | (2,050 | ) | �� | �� | (7,508 | ) | �� | �� | (18,015 | ) | �� | �� | (18,226 | ) |
| Prepaid expenses and other assets | �� | (380 | ) | �� | �� | 2,010 | �� | �� | �� | (584 | ) | �� | �� | 2,297 | �� |
| Accounts payable, accrued liabilities, and other liabilities | �� | (536 | ) | �� | �� | 3,404 | �� | �� | �� | 990 | �� | �� | �� | (1,727 | ) |
| Reserve for veterinary invoices | �� | (1,710 | ) | �� | �� | (1,650 | ) | �� | �� | 697 | �� | �� | �� | (2,535 | ) |
| Deferred revenue | �� | 4,051 | �� | �� | �� | 3,555 | �� | �� | �� | 19,764 | �� | �� | �� | 17,554 | �� |
| Net cash provided by operating activities | �� | 15,024 | �� | �� | �� | 6,855 | �� | �� | �� | 30,989 | �� | �� | �� | 9,290 | �� |
| Investing activities | �� | �� | �� | �� | �� | �� | �� | ||||||||
| Purchases of investment securities | �� | (101,125 | ) | �� | �� | (62,056 | ) | �� | �� | (142,000 | ) | �� | �� | (81,249 | ) |
| Maturities and sales of investment securities | �� | 61,022 | �� | �� | �� | 36,673 | �� | �� | �� | 94,264 | �� | �� | �� | 55,678 | �� |
| Purchases of property, equipment, and internal-use software | �� | (2,977 | ) | �� | �� | (2,880 | ) | �� | �� | (4,904 | ) | �� | �� | (5,945 | ) |
| Other | �� | 613 | �� | �� | �� | 546 | �� | �� | �� | 1,200 | �� | �� | �� | 1,062 | �� |
| Net cash used in investing activities | �� | (42,467 | ) | �� | �� | (27,717 | ) | �� | �� | (51,440 | ) | �� | �� | (30,454 | ) |
| Financing activities | �� | �� | �� | �� | �� | �� | �� | ||||||||
| Repayment of debt financing | �� | (15,187 | ) | �� | �� | (337 | ) | �� | �� | (15,525 | ) | �� | �� | (675 | ) |
| Proceeds from exercise of stock options | �� | 303 | �� | �� | �� | 99 | �� | �� | �� | 1,327 | �� | �� | �� | 471 | �� |
| Shares withheld to satisfy tax withholding | �� | (774 | ) | �� | �� | (343 | ) | �� | �� | (1,688 | ) | �� | �� | (588 | ) |
| Other | �� | (230 | ) | �� | �� | (377 | ) | �� | �� | (460 | ) | �� | �� | (452 | ) |
| Net cash used in financing activities | �� | (15,888 | ) | �� | �� | (958 | ) | �� | �� | (16,346 | ) | �� | �� | (1,244 | ) |
| Effect of foreign exchange rate changes on cash, cash equivalents, and restricted cash, net | �� | 1,792 | �� | �� | �� | (150 | ) | �� | �� | 1,738 | �� | �� | �� | (463 | ) |
| Net change in cash, cash equivalents, and restricted cash | �� | (41,539 | ) | �� | �� | (21,969 | ) | �� | �� | (35,059 | ) | �� | �� | (22,871 | ) |
| Cash, cash equivalents, and restricted cash at beginning of period | �� | 206,010 | �� | �� | �� | 169,562 | �� | �� | �� | 199,530 | �� | �� | �� | 170,464 | �� |
| Cash, cash equivalents, and restricted cash at end of period | $ | 164,471 | �� | �� | $ | 147,593 | �� | �� | $ | 164,471 | �� | �� | $ | 147,593 | �� |
| �� | |||||||||||||||
| The following tables set forth our key operating metrics. | |||||||||||||||||||||||||||||||
| �� | �� | �� | �� | �� | �� | �� | �� | �� | �� | �� | �� | �� | �� | �� | �� | ||||||||||||||||
| �� | Six Months Ended June 30, | �� | �� | �� | �� | �� | �� | �� | �� | �� | �� | �� | �� | ||||||||||||||||||
| �� | �� | 2025 | �� | �� | �� | 2024 | �� | �� | �� | �� | �� | �� | �� | �� | �� | �� | �� | �� | �� | ||||||||||||
| Total Business: | �� | �� | �� | �� | �� | �� | �� | �� | �� | �� | �� | �� | �� | �� | �� | ||||||||||||||||
| Total pets enrolled (at period end) | �� | 1,660,455 | �� | �� | �� | 1,699,643 | �� | �� | �� | �� | �� | �� | �� | �� | �� | �� | �� | �� | �� | ||||||||||||
| Subscription Business: | �� | �� | �� | �� | �� | �� | �� | �� | �� | �� | �� | �� | �� | �� | �� | ||||||||||||||||
| Total subscription pets enrolled (at period end) | �� | 1,066,354 | �� | �� | �� | 1,020,934 | �� | �� | �� | �� | �� | �� | �� | �� | �� | �� | �� | �� | �� | ||||||||||||
| Monthly average revenue per pet | $ | 78.73 | �� | �� | $ | 70.76 | �� | �� | �� | �� | �� | �� | �� | �� | �� | �� | �� | �� | �� | ||||||||||||
| Average pet acquisition cost (PAC) | $ | 272 | �� | �� | $ | 219 | �� | �� | �� | �� | �� | �� | �� | �� | �� | �� | �� | �� | �� | ||||||||||||
| Average monthly retention | �� | 98.29 | % | �� | �� | 98.34 | % | �� | �� | �� | �� | �� | �� | �� | �� | �� | �� | �� | �� | ||||||||||||
| �� | �� | �� | �� | �� | �� | �� | �� | �� | �� | �� | �� | �� | �� | �� | �� | ||||||||||||||||
| �� | �� | �� | �� | �� | �� | �� | �� | �� | �� | �� | �� | �� | �� | �� | �� | ||||||||||||||||
| �� | Three Months Ended | ||||||||||||||||||||||||||||||
| �� | Jun. 30, 2025 | �� | Mar. 31, 2025 | �� | Dec. 31, 2024 | �� | Sep. 30, 2024 | �� | Jun. 30, 2024 | �� | Mar. 31, 2024 | �� | Dec. 31, 2023 | �� | Sep. 30, 2023 | ||||||||||||||||
| Total Business: | �� | �� | �� | �� | �� | �� | �� | �� | �� | �� | �� | �� | �� | �� | �� | ||||||||||||||||
| Total pets enrolled (at period end) | �� | 1,660,455 | �� | �� | �� | 1,667,637 | �� | �� | �� | 1,677,570 | �� | �� | �� | 1,688,903 | �� | �� | �� | 1,699,643 | �� | �� | �� | 1,708,017 | �� | �� | �� | 1,714,473 | �� | �� | �� | 1,712,177 | �� |
| Subscription Business: | �� | �� | �� | �� | �� | �� | �� | �� | �� | �� | �� | �� | �� | �� | �� | ||||||||||||||||
| Total subscription pets enrolled (at period end) | �� | 1,066,354 | �� | �� | �� | 1,052,845 | �� | �� | �� | 1,041,212 | �� | �� | �� | 1,032,042 | �� | �� | �� | 1,020,934 | �� | �� | �� | 1,006,168 | �� | �� | �� | 991,426 | �� | �� | �� | 969,322 | �� |
| Monthly average revenue per pet | $ | 79.93 | �� | �� | $ | 77.53 | �� | �� | $ | 76.02 | �� | �� | $ | 74.27 | �� | �� | $ | 71.72 | �� | �� | $ | 69.79 | �� | �� | $ | 67.07 | �� | �� | $ | 65.82 | �� |
| Average pet acquisition cost (PAC) | $ | 276 | �� | �� | $ | 267 | �� | �� | $ | 261 | �� | �� | $ | 243 | �� | �� | $ | 231 | �� | �� | $ | 207 | �� | �� | $ | 217 | �� | �� | $ | 212 | �� |
| Average monthly retention | �� | 98.29 | % | �� | �� | 98.28 | % | �� | �� | 98.25 | % | �� | �� | 98.29 | % | �� | �� | 98.34 | % | �� | �� | 98.41 | % | �� | �� | 98.49 | % | �� | �� | 98.55 | % |
| �� | �� | �� | �� | �� | �� | �� | �� | �� | �� | �� | �� | �� | �� | �� | �� | �� | �� | �� | �� | �� | �� | �� | �� | �� | �� | �� | �� | �� | �� | �� | �� |
| The following table reflects the reconciliation of cash provided by operating activities to free cash flow (in thousands): | |||||||||||||||
| �� | �� | �� | �� | �� | �� | �� | �� | ||||||||
| �� | Three Months Ended June 30, | �� | Six Months Ended June 30, | ||||||||||||
| �� | �� | 2025 | �� | �� | �� | 2024 | �� | �� | �� | 2025 | �� | �� | �� | 2024 | �� |
| Net cash provided by operating activities | $ | 15,024 | �� | �� | $ | 6,855 | �� | �� | $ | 30,989 | �� | �� | $ | 9,290 | �� |
| Purchases of property, equipment, and internal-use software | �� | (2,977 | ) | �� | �� | (2,880 | ) | �� | �� | (4,904 | ) | �� | �� | (5,945 | ) |
| Free cash flow | $ | 12,047 | �� | �� | $ | 3,975 | �� | �� | $ | 26,085 | �� | �� | $ | 3,345 | �� |
| �� | |||||||||||||||
| The following tables reflect the reconciliation between GAAP and non-GAAP measures (in thousands except percentages): | ||||||||||||||||
| �� | �� | Three months ended June 30, | �� | Six Months Ended June 30, | ||||||||||||
| �� | �� | �� | 2025 | �� | �� | �� | 2024 | �� | �� | �� | 2025 | �� | �� | �� | 2024 | �� |
| Veterinary invoice expense | �� | $ | 255,580 | �� | �� | $ | 231,102 | �� | �� | $ | 503,030 | �� | �� | $ | 464,671 | �� |
| Less: | �� | �� | �� | �� | �� | �� | �� | �� | ||||||||
| Stock-based compensation expense(1) | �� | �� | (758 | ) | �� | �� | (843 | ) | �� | �� | (1,522 | ) | �� | �� | (1,705 | ) |
| Other business cost of paying veterinary invoices(2) | �� | �� | (82,706 | ) | �� | �� | (75,622 | ) | �� | �� | (161,975 | ) | �� | �� | (156,836 | ) |
| Subscription cost of paying veterinary invoices (non-GAAP) | �� | $ | 172,116 | �� | �� | $ | 154,637 | �� | �� | $ | 339,533 | �� | �� | $ | 306,130 | �� |
| % of subscription revenue | �� | �� | 71.1 | % | �� | �� | 74.1 | % | �� | �� | 71.4 | % | �� | �� | 74.7 | % |
| �� | �� | �� | �� | �� | �� | �� | �� | �� | ||||||||
| Other cost of revenue | �� | $ | 43,150 | �� | �� | $ | 43,429 | �� | �� | $ | 86,572 | �� | �� | $ | 79,754 | �� |
| Less: | �� | �� | �� | �� | �� | �� | �� | �� | ||||||||
| Stock-based compensation expense(1) | �� | �� | (601 | ) | �� | �� | (523 | ) | �� | �� | (1,082 | ) | �� | �� | (943 | ) |
| Other business variable expenses(2) | �� | �� | (20,531 | ) | �� | �� | (23,091 | ) | �� | �� | (42,267 | ) | �� | �� | (39,589 | ) |
| Subscription variable expenses (non-GAAP) | �� | $ | 22,018 | �� | �� | $ | 19,815 | �� | �� | $ | 43,223 | �� | �� | $ | 39,222 | �� |
| % of subscription revenue | �� | �� | 9.1 | % | �� | �� | 9.5 | % | �� | �� | 9.1 | % | �� | �� | 9.6 | % |
| �� | �� | �� | �� | �� | �� | �� | �� | �� | ||||||||
| Technology and development expense | �� | $ | 8,586 | �� | �� | $ | 8,190 | �� | �� | $ | 16,658 | �� | �� | $ | 15,150 | �� |
| General and administrative expense | �� | �� | 20,122 | �� | �� | �� | 15,253 | �� | �� | �� | 40,014 | �� | �� | �� | 29,926 | �� |
| Less: | �� | �� | �� | �� | �� | �� | �� | �� | ||||||||
| Stock-based compensation expense(1) | �� | �� | (6,393 | ) | �� | �� | (4,949 | ) | �� | �� | (11,788 | ) | �� | �� | (9,208 | ) |
| Development expenses(3) | �� | �� | (946 | ) | �� | �� | (1,655 | ) | �� | �� | (2,353 | ) | �� | �� | (2,832 | ) |
| Fixed expenses (non-GAAP) | �� | $ | 21,369 | �� | �� | $ | 16,839 | �� | �� | $ | 42,531 | �� | �� | $ | 33,036 | �� |
| % of total revenue | �� | �� | 6.0 | % | �� | �� | 5.3 | % | �� | �� | 6.1 | % | �� | �� | 5.3 | % |
| �� | �� | �� | �� | �� | �� | �� | �� | �� | ||||||||
| New pet acquisition expense | �� | $ | 19,843 | �� | �� | $ | 17,874 | �� | �� | $ | 40,359 | �� | �� | $ | 34,717 | �� |
| Less: | �� | �� | �� | �� | �� | �� | �� | �� | ||||||||
| Stock-based compensation expense(1) | �� | �� | (1,516 | ) | �� | �� | (2,066 | ) | �� | �� | (4,390 | ) | �� | �� | (3,923 | ) |
| Other business pet acquisition expense(2) | �� | �� | (74 | ) | �� | �� | (10 | ) | �� | �� | (77 | ) | �� | �� | (23 | ) |
| Subscription acquisition cost (non-GAAP) | �� | $ | 18,253 | �� | �� | $ | 15,798 | �� | �� | $ | 35,892 | �� | �� | $ | 30,771 | �� |
| % of subscription revenue | �� | �� | 7.5 | % | �� | �� | 7.6 | % | �� | �� | 7.6 | % | �� | �� | 7.5 | % |
| (1) Trupanion employees may elect to take restricted stock units in lieu of cash payment for their bonuses. We account for such expense as stock-based compensation according to GAAP, but we do not include it in any non-GAAP adjustments. Stock-based compensation associated with bonuses was approximately (2) Excludes the portion of stock-based compensation expense attributable to the other business segment������������������������������������������������������������������������������������������������������������������������������������������������������������������������������������������������������������������������������������������������������������������������������������������������������������������������������������������������������������������������������������������������������������������������������������������������������������������������������������������������������������������������������������������������������������������������������������������������������������������������������������������������������������������������������������������������������������������������������������������������������������������������ (3) Consists of costs related to product exploration and development that are pre-revenue and historically have been insignificant. | ||||||||||||||||
| The following tables reflect the reconciliation of GAAP measures to non-GAAP measures (in thousands, except percentages): | |||||||||||||||
| �� | Three Months Ended June 30, | �� | Six Months Ended June 30, | ||||||||||||
| �� | �� | 2025 | �� | �� | �� | 2024 | �� | �� | �� | 2025 | �� | �� | �� | 2024 | �� |
| Operating income (loss) | $ | 2,314 | �� | �� | $ | (5,471 | ) | �� | $ | 841 | �� | �� | $ | (11,608 | ) |
| Non-GAAP expense adjustments | �� | �� | �� | �� | �� | �� | �� | ||||||||
| Acquisition cost | �� | 18,327 | �� | �� | �� | 15,808 | �� | �� | �� | 35,969 | �� | �� | �� | 30,793 | �� |
| Stock-based compensation expense(1) | �� | 9,268 | �� | �� | �� | 8,381 | �� | �� | �� | 18,782 | �� | �� | �� | 15,780 | �� |
| Development expenses(2) | �� | 946 | �� | �� | �� | 1,656 | �� | �� | �� | 2,353 | �� | �� | �� | 2,833 | �� |
| Depreciation and amortization | �� | 3,962 | �� | �� | �� | 4,376 | �� | �� | �� | 7,753 | �� | �� | �� | 8,161 | �� |
| Loss from investment in joint venture | �� | �� | �� | �� | �� | (47 | ) | �� | �� | (305 | ) | �� | �� | (150 | ) |
| Total adjusted operating income (non-GAAP) | $ | 34,817 | �� | �� | $ | 24,797 | �� | �� | $ | 66,003 | �� | �� | $ | 46,109 | �� |
| �� | �� | �� | �� | �� | �� | �� | �� | ||||||||
| Subscription Business: | �� | �� | �� | �� | �� | �� | �� | ||||||||
| Subscription operating income (loss) | $ | 4,523 | �� | �� | $ | (3,420 | ) | �� | $ | 5,590 | �� | �� | $ | (7,939 | ) |
| Non-GAAP expense adjustments | �� | �� | �� | �� | �� | �� | �� | ||||||||
| Acquisition cost | �� | 18,253 | �� | �� | �� | 15,798 | �� | �� | �� | 35,892 | �� | �� | �� | 30,771 | �� |
| Stock-based compensation expense(1) | �� | 7,248 | �� | �� | �� | 6,631 | �� | �� | �� | 15,017 | �� | �� | �� | 12,512 | �� |
| Development expenses(2) | �� | 648 | �� | �� | �� | 1,097 | �� | �� | �� | 1,610 | �� | �� | �� | 1,871 | �� |
| Depreciation and amortization | �� | 2,714 | �� | �� | �� | 2,900 | �� | �� | �� | 5,297 | �� | �� | �� | 5,385 | �� |
| Subscription adjusted operating income (non-GAAP) | $ | 33,386 | �� | �� | $ | 23,006 | �� | �� | $ | 63,406 | �� | �� | $ | 42,600 | �� |
| �� | �� | �� | �� | �� | �� | �� | �� | ||||||||
| Other Business: | �� | �� | �� | �� | �� | �� | �� | ||||||||
| Other business operating loss | $ | (2,209 | ) | �� | $ | (2,004 | ) | �� | $ | (4,444 | ) | �� | $ | (3,519 | ) |
| Non-GAAP expense adjustments | �� | �� | �� | �� | �� | �� | �� | ||||||||
| Acquisition cost | �� | 74 | �� | �� | �� | 10 | �� | �� | �� | 77 | �� | �� | �� | 22 | �� |
| Stock-based compensation expense(1) | �� | 2,020 | �� | �� | �� | 1,750 | �� | �� | �� | 3,765 | �� | �� | �� | 3,268 | �� |
| Development expenses(2) | �� | 298 | �� | �� | �� | 559 | �� | �� | �� | 743 | �� | �� | �� | 962 | �� |
| Depreciation and amortization | �� | 1,248 | �� | �� | �� | 1,476 | �� | �� | �� | 2,456 | �� | �� | �� | 2,776 | �� |
| Other business adjusted operating income (non-GAAP) | $ | 1,431 | �� | �� | $ | 1,790 | �� | �� | $ | 2,597 | �� | �� | $ | 3,510 | �� |
| (1) Trupanion employees may elect to take restricted stock units in lieu of cash payment for their bonuses. We account for such expense as stock-based compensation in accordance with GAAP, but we do not include it in any non-GAAP adjustments. Stock-based compensation associated with bonuses was approximately | |||||||||||||||
| (2) Consists of costs related to product exploration and development that are pre-revenue and historically have been insignificant. | |||||||||||||||
| �� | |||||||||||||||
| The following tables reflect the reconciliation of GAAP measures to non-GAAP measures (in thousands, except percentages): | ||||||||||||||||
| �� | �� | Three Months Ended June 30, | �� | Six Months Ended June 30, | ||||||||||||
| �� | �� | �� | ||||||||||||||
| �� | �� | �� | 2025 | �� | �� | �� | 2024 | �� | �� | �� | 2025 | �� | �� | �� | 2024 | �� |
| Subscription revenue | �� | $ | 242,156 | �� | �� | $ | 208,618 | �� | �� | $ | 475,220 | �� | �� | $ | 409,752 | �� |
| Subscription cost of paying veterinary invoices | �� | �� | 172,116 | �� | �� | �� | 154,637 | �� | �� | �� | 339,533 | �� | �� | �� | 306,130 | �� |
| Subscription variable expenses | �� | �� | 22,018 | �� | �� | �� | 19,815 | �� | �� | �� | 43,223 | �� | �� | �� | 39,222 | �� |
| Subscription fixed expenses* | �� | �� | 14,636 | �� | �� | �� | 11,160 | �� | �� | �� | 29,058 | �� | �� | �� | 21,800 | �� |
| Subscription adjusted operating income (non-GAAP) | �� | $ | 33,386 | �� | �� | $ | 23,006 | �� | �� | $ | 63,406 | �� | �� | $ | 42,600 | �� |
| �� | �� | �� | �� | �� | �� | �� | �� | �� | ||||||||
| Other business revenue | �� | $ | 111,401 | �� | �� | �� | 106,182 | �� | �� | $ | 220,312 | �� | �� | $ | 211,169 | �� |
| Other business cost of paying veterinary invoices | �� | �� | 82,706 | �� | �� | �� | 75,622 | �� | �� | �� | 161,975 | �� | �� | �� | 156,836 | �� |
| Other business variable expenses | �� | �� | 20,531 | �� | �� | �� | 23,090 | �� | �� | �� | 42,267 | �� | �� | �� | 39,588 | �� |
| Other business fixed expenses* | �� | �� | 6,733 | �� | �� | �� | 5,679 | �� | �� | �� | 13,473 | �� | �� | �� | 11,236 | �� |
| Other business adjusted operating income (non-GAAP) | �� | $ | 1,431 | �� | �� | $ | 1,791 | �� | �� | $ | 2,597 | �� | �� | $ | 3,509 | �� |
| �� | �� | �� | �� | �� | �� | �� | �� | �� | ||||||||
| Revenue | �� | $ | 353,557 | �� | �� | $ | 314,800 | �� | �� | $ | 695,532 | �� | �� | $ | 620,921 | �� |
| Cost of paying veterinary invoices | �� | �� | 254,822 | �� | �� | �� | 230,259 | �� | �� | �� | 501,508 | �� | �� | �� | 462,966 | �� |
| Variable expenses | �� | �� | 42,549 | �� | �� | �� | 42,905 | �� | �� | �� | 85,490 | �� | �� | �� | 78,810 | �� |
| Fixed expenses* | �� | �� | 21,369 | �� | �� | �� | 16,839 | �� | �� | �� | 42,531 | �� | �� | �� | 33,036 | �� |
| Total business adjusted operating income (non-GAAP) | �� | $ | 34,817 | �� | �� | $ | 24,797 | �� | �� | $ | 66,003 | �� | �� | $ | 46,109 | �� |
| �� | �� | �� | �� | �� | �� | �� | �� | �� | ||||||||
| As a percentage of revenue: | �� | Three Months Ended June 30, | �� | Six Months Ended June 30, | ||||||||||||
| �� | �� | �� | 2025 | �� | �� | �� | 2024 | �� | �� | �� | 2025 | �� | �� | �� | 2024 | �� |
| Subscription revenue | �� | �� | 100.0 | % | �� | �� | 100.0 | % | �� | �� | 100.0 | % | �� | �� | 100.0 | % |
| Subscription cost of paying veterinary invoices | �� | �� | 71.1 | % | �� | �� | 74.1 | % | �� | �� | 71.4 | % | �� | �� | 74.7 | % |
| Subscription variable expenses | �� | �� | 9.1 | % | �� | �� | 9.5 | % | �� | �� | 9.1 | % | �� | �� | 9.6 | % |
| Subscription fixed expenses* | �� | �� | 6.0 | % | �� | �� | 5.3 | % | �� | �� | 6.1 | % | �� | �� | 5.3 | % |
| Subscription adjusted operating income (non-GAAP) | �� | �� | 13.8 | % | �� | �� | 11.0 | % | �� | �� | 13.3 | % | �� | �� | 10.4 | % |
| �� | �� | �� | �� | �� | �� | �� | �� | �� | ||||||||
| Other business revenue | �� | �� | 100.0 | % | �� | �� | 100.0 | % | �� | �� | 100.0 | % | �� | �� | 100.0 | % |
| Other business cost of paying veterinary invoices | �� | �� | 74.2 | % | �� | �� | 71.2 | % | �� | �� | 73.5 | % | �� | �� | 74.3 | % |
| Other business variable expenses | �� | �� | 18.4 | % | �� | �� | 21.7 | % | �� | �� | 19.2 | % | �� | �� | 18.7 | % |
| Other business fixed expenses* | �� | �� | 6.0 | % | �� | �� | 5.3 | % | �� | �� | 6.1 | % | �� | �� | 5.3 | % |
| Other business adjusted operating income (non-GAAP) | �� | �� | 1.3 | % | �� | �� | 1.7 | % | �� | �� | 1.2 | % | �� | �� | 1.7 | % |
| �� | �� | �� | �� | �� | �� | �� | �� | �� | ||||||||
| Revenue | �� | �� | 100.0 | % | �� | �� | 100.0 | % | �� | �� | 100.0 | % | �� | �� | 100.0 | % |
| Cost of paying veterinary invoices | �� | �� | 72.1 | % | �� | �� | 73.1 | % | �� | �� | 72.1 | % | �� | �� | 74.6 | % |
| Variable expenses | �� | �� | 12.0 | % | �� | �� | 13.6 | % | �� | �� | 12.3 | % | �� | �� | 12.7 | % |
| Fixed expenses* | �� | �� | 6.0 | % | �� | �� | 5.3 | % | �� | �� | 6.1 | % | �� | �� | 5.3 | % |
| Total business adjusted operating income (non-GAAP) | �� | �� | 9.8 | % | �� | �� | 7.9 | % | �� | �� | 9.5 | % | �� | �� | 7.4 | % |
| �� | �� | �� | �� | �� | �� | �� | �� | �� | ||||||||
| *Fixed expenses represent shared services that support both our subscription and other business segments and, as such, are generally allocated to each segment pro-rata based on revenues. | ||||||||||||||||
| �� | ||||||||||||||||
Adjusted operating income is a non-GAAP financial measure that adjusts operating income (loss) to remove the effect of acquisition cost, development expenses, non-recurring transaction or restructuring expenses, and gain (loss) from investment in joint venture. Non-cash items, such as stock-based compensation expense and depreciation and amortization, are also excluded. Acquisition cost, development expenses, gain (loss) from investment in joint venture, stock-based compensation expense, and depreciation and amortization are expected to remain recurring expenses for the foreseeable future, but are excluded from this metric to measure scale in other areas of the business.��Management believes acquisition costs primarily represent the cost to acquire new subscribers and are driven by the amount of growth we choose to pursue based primarily on the amount of our adjusted operating income period over period.��Accordingly, this measure is not indicative of our core operating income performance.��We also exclude development expenses, gain (loss) from investment in joint venture, stock-based compensation expense, and depreciation and amortization because we do not view those items as reflective of our core operating income performance.
Management uses adjusted operating income and the margin on adjusted operating income to understand the effects of scale in its non-acquisition cost and development expenses and to plan future advertising expenditures, which are designed to acquire new pets. Management uses this measure as a principal way of understanding the operating performance of its business exclusive of acquisition cost and new product exploration and development initiatives.�� Management believes disclosure of this metric provides investors with the same data that the Company employs in assessing its overall operations and that disclosure of this measure may provide useful information regarding the efficiency of our utilization of revenues, return on advertising dollars in the form of new subscribers and future use of available cash to support the continued growth of our business.
| The following tables reflect the reconciliation of adjusted EBITDA to net loss (in thousands): | |||||||||||||||||||||||||||||||
| �� | �� | �� | �� | �� | �� | �� | �� | �� | �� | �� | �� | �� | �� | �� | �� | ||||||||||||||||
| �� | Six Months Ended June 30, | �� | �� | �� | �� | �� | �� | �� | �� | �� | �� | �� | �� | ||||||||||||||||||
| �� | �� | 2025 | �� | �� | �� | 2024 | �� | �� | �� | �� | �� | �� | �� | �� | �� | �� | �� | �� | �� | ||||||||||||
| Net Income (loss) | $ | 7,930 | �� | �� | $ | (12,714 | ) | �� | �� | �� | �� | �� | �� | �� | �� | �� | �� | �� | �� | ||||||||||||
| Excluding: | �� | �� | �� | �� | �� | �� | �� | �� | �� | �� | �� | �� | �� | �� | �� | ||||||||||||||||
| Stock-based compensation expense | �� | 18,782 | �� | �� | �� | 15,779 | �� | �� | �� | �� | �� | �� | �� | �� | �� | �� | �� | �� | �� | ||||||||||||
| Depreciation and amortization expense | �� | 7,753 | �� | �� | �� | 8,161 | �� | �� | �� | �� | �� | �� | �� | �� | �� | �� | �� | �� | �� | ||||||||||||
| Interest income | �� | (5,940 | ) | �� | �� | (6,180 | ) | �� | �� | �� | �� | �� | �� | �� | �� | �� | �� | �� | �� | ||||||||||||
| Interest expense | �� | 6,893 | �� | �� | �� | 7,251 | �� | �� | �� | �� | �� | �� | �� | �� | �� | �� | �� | �� | �� | ||||||||||||
| Income tax (benefit) expense | �� | 1,172 | �� | �� | �� | (82 | ) | �� | �� | �� | �� | �� | �� | �� | �� | �� | �� | �� | �� | ||||||||||||
| AG���˹ٷ�ized gain on nonmonetary exchange of preferred stock investment | �� | (7,783 | ) | �� | �� | �� | �� | �� | �� | �� | �� | �� | �� | �� | �� | �� | �� | �� | �� | ||||||||||||
| Adjusted EBITDA | $ | 28,807 | �� | �� | $ | 12,215 | �� | �� | �� | �� | �� | �� | �� | �� | �� | �� | �� | �� | �� | ||||||||||||
| �� | �� | �� | �� | �� | �� | �� | �� | �� | �� | �� | �� | �� | �� | �� | �� | ||||||||||||||||
| �� | Three Months Ended | ||||||||||||||||||||||||||||||
| �� | Jun. 30, 2025 | �� | Mar. 31, 2025 | �� | Dec. 31, 2024 | �� | Sep. 30, 2024 | �� | Jun. 30, 2024 | �� | Mar. 31, 2024 | �� | Dec. 31, 2023 | �� | Sep. 30, 2023 | ||||||||||||||||
| Net Income (loss) | $ | 9,413 | �� | �� | $ | (1,483 | ) | �� | $ | 1,656 | �� | �� | $ | 1,425 | �� | �� | $ | (5,862 | ) | �� | $ | (6,852 | ) | �� | $ | (2,163 | ) | �� | $ | (4,036 | ) |
| Excluding: | �� | �� | �� | �� | �� | �� | �� | �� | �� | �� | �� | �� | �� | �� | �� | ||||||||||||||||
| Stock-based compensation expense | �� | 9,268 | �� | �� | �� | 9,514 | �� | �� | �� | 8,036 | �� | �� | �� | 8,127 | �� | �� | �� | 8,381 | �� | �� | �� | 7,398 | �� | �� | �� | 6,636 | �� | �� | �� | 6,585 | �� |
| Depreciation and amortization expense | �� | 3,962 | �� | �� | �� | 3,791 | �� | �� | �� | 3,924 | �� | �� | �� | 4,381 | �� | �� | �� | 4,376 | �� | �� | �� | 3,785 | �� | �� | �� | 3,029 | �� | �� | �� | 2,990 | �� |
| Interest income | �� | (3,105 | ) | �� | �� | (2,835 | ) | �� | �� | (2,999 | ) | �� | �� | (3,232 | ) | �� | �� | (3,135 | ) | �� | �� | (3,045 | ) | �� | �� | (2,842 | ) | �� | �� | (2,389 | ) |
| Interest expense | �� | 3,682 | �� | �� | �� | 3,211 | �� | �� | �� | 3,427 | �� | �� | �� | 3,820 | �� | �� | �� | 3,655 | �� | �� | �� | 3,596 | �� | �� | �� | 3,697 | �� | �� | �� | 3,053 | �� |
| Income tax (benefit) expense | �� | 1,133 | �� | �� | �� | 39 | �� | �� | �� | 38 | �� | �� | �� | 39 | �� | �� | �� | (44 | ) | �� | �� | (38 | ) | �� | �� | 130 | �� | �� | �� | (43 | ) |
| Goodwill impairment charges | �� | �� | �� | �� | �� | �� | �� | �� | �� | 5,299 | �� | �� | �� | �� | �� | �� | �� | �� | �� | �� | �� | �� | �� | �� | �� | �� | �� | �� | �� | �� | �� |
| Non-recurring transaction or restructuring expenses | �� | �� | �� | �� | �� | �� | �� | �� | �� | �� | �� | �� | �� | �� | �� | �� | �� | �� | �� | �� | �� | �� | �� | �� | �� | �� | �� | �� | �� | 8 | �� |
| Gain from equity method investment | �� | �� | �� | �� | �� | �� | �� | �� | �� | �� | �� | �� | �� | (33 | ) | �� | �� | �� | �� | �� | �� | �� | �� | �� | �� | �� | �� | �� | �� | (110 | ) |
| AG���˹ٷ�ized gain on nonmonetary exchange of preferred stock investment | �� | (7,783 | ) | �� | �� | �� | �� | �� | �� | �� | �� | �� | �� | �� | �� | �� | �� | �� | �� | �� | �� | �� | �� | �� | �� | �� | �� | �� | �� | �� | �� |
| Adjusted EBITDA | $ | 16,570 | �� | �� | $ | 12,237 | �� | �� | $ | 19,381 | �� | �� | $ | 14,527 | �� | �� | $ | 7,371 | �� | �� | $ | 4,844 | �� | �� | $ | 8,487 | �� | �� | $ | 6,058 | �� |
| �� | |||||||||||||||||||||||||||||||
Contacts:
Investors:
Laura Bainbridge, Senior Vice President, Corporate Communications
Gil Melchior, Director, Investor Relations
[email protected]
An infographic��accompanying this announcement is available at
