Discovery Reports 50,552 Ounces of Gold Production, $27.3 Million of Free Cash Flow¹ in Q2 2025
Discovery Silver Corp. (OTCQX: DSVSF) reported strong Q2 2025 results following its transformational acquisition of the Porcupine Complex. The company produced 50,552 ounces of gold in its first 76 days of operations, generating $142.0 million in revenue and $27.3 million in free cash flow.
Key financial metrics include net earnings of $5.5 million ($0.01/share), adjusted net earnings of $28.4 million ($0.04/share), and operating cash costs of $1,334/oz. The company maintained a solid cash position of $252.5 million with working capital of $225.9 million, supported by a $575.0 million financing package.
Production breakdown included 16,112 oz from Hoyle Pond, 27,286 oz from Borden, and 7,154 oz from Pamour, with gold sales of 42,550 ounces at an average realized price of $3,337/oz.
Discovery Silver Corp. (OTCQX: DSVSF) ha riportato risultati solidi per il Q2 2025 a seguito della sua acquisizione trasformativa del Porcupine Complex. La società ha prodotto 50.552 once d'oro nei suoi primi 76 giorni di attività, generando 142,0 milioni di dollari di ricavi e 27,3 milioni di dollari di free cash flow.
I principali indicatori finanziari includono un utile netto di 5,5 milioni di dollari (0,01 $/azione), un utile netto rettificato di 28,4 milioni di dollari (0,04 $/azione) e costi operativi in cash di 1.334 $/oz. La società ha mantenuto una solida posizione di cassa di 252,5 milioni di dollari con capitale circolante di 225,9 milioni, supportata da un pacchetto di finanziamento da 575,0 milioni di dollari.
La produzione è stata così ripartita: 16.112 oz da Hoyle Pond, 27.286 oz da Borden e 7.154 oz da Pamour, con vendite d'oro pari a 42.550 once a un prezzo medio realizzato di 3.337 $/oz.
Discovery Silver Corp. (OTCQX: DSVSF) informó sólidos resultados del 2T 2025 tras su adquisición transformadora del Porcupine Complex. La compañía produjo 50.552 onzas de oro en sus primeros 76 días de operación, generando 142,0 millones de dólares en ingresos y 27,3 millones de dólares de flujo de caja libre.
Las métricas financieras clave incluyen un resultado neto de 5,5 millones de dólares (0,01 $/acción), resultado neto ajustado de 28,4 millones de dólares (0,04 $/acción) y costos de efectivo operativos de 1.334 $/oz. La compañía mantuvo una sólida posición de efectivo de 252,5 millones de dólares con capital de trabajo de 225,9 millones, respaldada por un paquete de financiamiento de 575,0 millones de dólares.
La producción se desglosó en 16.112 oz de Hoyle Pond, 27.286 oz de Borden y 7.154 oz de Pamour, con ventas de oro de 42.550 onzas a un precio realizado promedio de 3.337 $/oz.
Discovery Silver Corp. (OTCQX: DSVSF)�� Porcupine Complex�� 획기적인 인수 이후 2025�� 2분기�� 견고�� 실적�� 보고했습니다. 회사�� 운영 시작 �� �� 76�� 동안 �� 50,552온스�� 생산하여 1��4,200�� 달러�� 매출�� 2,730�� 달러�� 자유현금흐름�� 창출했습니다.
주요 재무 지표로�� 순이�� 550�� 달러(주당 0.01달러), 조정 순이�� 2,840�� 달러(주당 0.04달러), 그리�� 운영 현금비용 온스�� 1,334달러가 포함됩니��. 회사�� 2��5,250�� 달러�� 현금�� 2��2,590�� 달러�� 운전자본�� 보유하고 있으��, 5��7,500�� 달러 규모�� 금융 패키지�� 이를 지원받�� 있습니다.
생산 내역은 Hoyle Pond 16,112 oz, Borden 27,286 oz, Pamour 7,154 oz이며, �� 판매량은 42,550온스�� 평균 실현 단가�� 온스�� 3,337달러옶�습니��.
Discovery Silver Corp. (OTCQX: DSVSF) a publié de solides résultats au T2 2025 suite à son acquisition transformative du Porcupine Complex. La société a produit 50 552 onces d'or au cours de ses 76 premiers jours d'exploitation, générant 142,0 millions de dollars de chiffre d'affaires et 27,3 millions de dollars de flux de trésorerie disponible.
Les principaux indicateurs financiers comprennent un résultat net de 5,5 M$ (0,01 $/action), un résultat net ajusté de 28,4 M$ (0,04 $/action) et des coûts opérationnels en cash de 1 334 $/once. La société disposait d'une position de trésorerie solide de 252,5 M$ avec un fonds de roulement de 225,9 M$, soutenue par un pack de financement de 575,0 M$.
La production se répartit comme suit : 16 112 oz de Hoyle Pond, 27 286 oz de Borden et 7 154 oz de Pamour, avec des ventes d'or de 42 550 onces à un prix réalisé moyen de 3 337 $/oz.
Discovery Silver Corp. (OTCQX: DSVSF) meldete nach der wegweisenden Übernahme des Porcupine Complex starke Ergebnisse für das 2. Quartal 2025. Das Unternehmen produzierte in den ersten 76 Betriebstagen 50.552 Unzen Gold und erzielte 142,0 Mio. USD Umsatz sowie 27,3 Mio. USD Free Cashflow.
Wesentliche Finanzkennzahlen sind ein Nettoergebnis von 5,5 Mio. USD (0,01 USD/Aktie), ein bereinigtes Nettoergebnis von 28,4 Mio. USD (0,04 USD/Aktie) und operative Cash-Kosten von 1.334 USD/oz. Das Unternehmen hielt eine solide Barposition von 252,5 Mio. USD mit einem Working Capital von 225,9 Mio. USD, gestützt durch ein Finanzierungspaket über 575,0 Mio. USD.
Die Produktion setzte sich zusammen aus 16.112 oz von Hoyle Pond, 27.286 oz von Borden und 7.154 oz von Pamour, wobei die Goldverkäufe 42.550 Unzen zu einem durchschnittlich realisierten Preis von 3.337 USD/oz betrugen.
- Significant revenue of $142.0M in first quarter as gold producer
- Strong free cash flow of $27.3M and operating cash flow of $67.1M
- Solid cash position of $252.5M with additional $100M undrawn credit facility
- High gold price realization of $3,337/oz providing strong margins
- Successfully secured $575.0M financing package for operations
- Gold sales (42,550 oz) lagged production (50,552 oz), with inventory carried to Q3
- High AISC of $2,123/oz compared to industry averages
- Significant acquisition-related costs of $16.6M impacting net earnings
- Foreign exchange losses of $6.8M affecting bottom line
- TRANSFORMATIONAL QUARTER
- Acquired Porcupine Complex on April 15th, establishes Discovery as growing Canadian gold producer
- Finalized
$575.0 million financing package, including$475.0M of royalty & equity financing,$100.0M senior debt facility
- Q2 2025 NET EARNINGS AND EPS
- Net earnings of
$5.5M ($0.01 /share) versus net loss of$5.1M ($0.01 /share) in Q2 2024; Adjusted net earnings1 totaled$28.4 million or$0.04 per share
- Net earnings of
- INITIAL GOLD PRODUCTION IN Q2 2025
- 50,552 produced from April 16 �� June 30; Production included 16,112 oz from Hoyle Pond, 27,286 oz from Borden and 7,154 oz from Pamour
- OPERATING CASH COSTS IN LINE WITH EXPECTATIONS
- Operating cash costs1,2 of
$48.8M or$1,334 /oz sold��
- Operating cash costs1,2 of
- ATTRACTIVE MARGINS DRIVE PROFITABILITY AND CASH FLOW��
- All-in sustaining costs (“AISC��)1,2 averaged
$2,123 /oz sold versus average realized gold price1 of$3,337 /oz; Site-level AISC3 averaged$1,872 /oz sold
- All-in sustaining costs (“AISC��)1,2 averaged
- STRONG CASH FLOW FROM GOLD SALES
- Net cash from operating activities of
$67.1M ; Free cash flow1 of$27.3M
- Net cash from operating activities of
- SOLID CASH POSITION TO SUPPORT OPERATIONS AND GROWTH PLANS
- Cash at June 30, 2025, totaled
$252.5M ; with working capital of$225.9 million ; Additional$100.0M of liquidity at June 30, 2025, through undrawn credit facility
- Cash at June 30, 2025, totaled
1. Example of Non-GAAP measure. See the section in this press release entitled, “NON-GAAP MEASURES�� for more information.
2. Operating cash costs and AISC include results from the Hoyle Pond and Borden operating mines, as well as corporate expenditures where applicable. They do not include operating costs, capital expenditures, or gold ounces sold from Pamour, which is a capital project that continues to ramp up towards commercial levels of production.
3. Site-level AISC excludes corporate G&A expense, share-based compensation costs and corporate-level sustaining capital expenditures.
TORONTO, Aug. 12, 2025 (GLOBE NEWSWIRE) -- Discovery Silver Corp. (TSX: DSV, OTCQX: DSVSF) (��Discovery�� or the ��Company��) today announced the Company’s financial and operating results for the second quarter (“Q2 2025��) and first six months (“YTD 2025��) of 2025. Q2 2025 represents the first quarter Discovery has reported the results of gold production and sales following the Company’s acquisition (��Acquisition�� or ��Porcupine Acquisition��) of the Porcupine Complex (��Porcupine�� or the ��Porcupine Operations��) in and near Timmins, Ontario on April 15, 2025. The Company’s full financial statements and management discussion & analysis are available on SEDAR+ at and on the Company’s website at . All dollar amounts are in US dollars, unless otherwise noted.
Tony Makuch, Discovery’s CEO, commented: “Q2 2025 was Discovery’s first quarter as a Canadian gold producer. During the quarter, we integrated systems, strengthened management structures and began implementing investment programs at Porcupine aimed at improving existing operations and pursuing growth opportunities. It was a significant challenge, and I want to thank our team for delivering a quarter of excellent progress. We also turned in a solid quarter of operating and financial performance, producing 50,552 ounces in the 76 days that we owned the assets. ��Gold sales of 42,550 ounces were below gold produced with the gold inventory at quarter end to be sold during Q3 2025. Net cash from operations totaled 67.1 million, while free cash flow was
“Key investment programs initiated during Q2 205 included investments at Dome Mill, mainly in the crushing, grinding and carbon handling circuits, advancing work at the Dome tailings management area (“TMA��), continuing to ramp up Pamour, with pre-stripping and production levels meeting target levels, and commencing investments at Hoyle Pond and Borden to optimize and grow the operations. We also began deploying drills as part of an extensive exploration program targeting numerous near-mine and district targets at Hoyle Pond, Borden and Pamour, and supporting the evaluation of high-potential new sources of production, including the TVZ zone and the resumption of mining at Dome Mine.
“Looking ahead, we are targeting production levels to increase in the final two quarters of the year. We also plan to ramp up our capital investment and exploration programs as we move forward with our growth and value creation plans for Porcupine.��
SUMMARY OF Q2 2025 PERFORMANCE
| �� | Three months ended | �� | ����Six months ended | �� | |||||||
| �� | June 30, | June 30, | March 31 | June 30 | �� | June 30, | �� | ||||
| �� | �� | 2025 | �� | 2024 | �� | 2025 | �� | 2025 | �� | 2025 | �� |
| Revenue | $ | 142,010 | $ | - | $ | - | $ | 142,010 | $ | - | �� |
| Production costs | $ | 54,919 | �� | - | �� | - | �� | 54,919 | �� | - | �� |
| Earnings before income taxes | $ | 24,510 | �� | (5,138) | �� | (6,452) | $ | 18,058 | $ | (5,643) | �� |
| Net earnings | $ | 5,534 | $ | (5,138) | $ | (6,452) | $ | (918) | $ | (5,643) | �� |
| Basic earnings per share | $ | 0.01 | $ | (0.01) | $ | (0.02) | $ | (0.00) | $ | (0.01) | �� |
| Diluted earnings per share | $ | 0.01 | $ | (0.01) | $ | (0.02) | $ | (0.00) | $ | (0.01) | �� |
| Cash flow from operating activities | $ | 67,081 | $ | (8,543) | $ | (6,075) | $ | 61,005 | $ | (11,014) | �� |
| Cash investment on mine development and PPE | $ | (39,766) | $ | (2,141) | $ | (3,767) | $ | (43,533) | $ | (5,448) | �� |
| �� | |||||||||||
| �� | Three months ended | �� | ����Six months ended | �� | |||||||
| �� | June 30, | June 30, | March 31 | June 30 | �� | June 30, | �� | ||||
| �� | �� | 2025 | �� | 2024 | �� | 2025 | �� | 2025 | �� | 2025 | �� |
| Tonnes milled | �� | 508,791 | �� | - | �� | - | �� | 508,791 | �� | - | �� |
| Average Grade (g/t Au) | �� | 3.39 | �� | - | �� | - | �� | 3.39 | �� | - | �� |
| Recovery (%) | �� | �� | - | �� | - | �� | �� | - | �� | ||
| Gold produced (oz) | �� | ��50,552 | �� | - | �� | - | �� | ��50,552 | �� | - | �� |
| Gold sold (oz) | �� | ��42,550 | �� | - | �� | - | �� | ��42,550 | �� | - | �� |
| Average realized price ($/oz sold) | $ | ��3,337 | $ | - | $ | - | $ | ��3,337 | $ | - | �� |
| Operating cash costs per ounce sold ($/oz)(1)(2) | $ | ��1,334 | $ | - | $ | - | $ | ��1,334 | $ | - | �� |
| AISC per ounce sold ($/oz)(1)(2)(3) | $ | ��2,123 | $ | - | $ | - | $ | ��2,123 | $ | - | �� |
| Adjusted net earnings(1) | $ | 28,434�� | $ | ��(2,107) | $ | (3,046) | $ | 25,338�� | $ | ��(4,078) | �� |
| Adjusted net earnings per share(1) | $ | 0.04 | $ | ��(0.01) | $ | ��(0.01) | $ | 0.04 | $ | ��(0.01) | �� |
| Free cash flow(1) | $ | ��27,314 | $ | (10,684) | $ | (9,842) | $ | ��17,472 | $ | (16,462) | �� |
| �� | |||||||||||
| (1) Example of Non-GAAP measure. See the section in this press release entitled, “NON-GAAP MEASURES�� for more information. | |||||||||||
| (2) Consolidated operating cash costs per ounce sold and AISC per ounce sold include results from the Hoyle Pond and Borden operating mines, as well as corporate expenditures where applicable. They do not include operating costs, capital expenditures, or gold ounces sold from Pamour, which is a capital project that continues to ramp up towards commercial levels of production.�� | |||||||||||
| (3) YTD 2025 results exclude G&A expense, share-based compensation costs and sustaining capital expenditures and lease expense incurred prior to the April 15, 2025, the completion date of the Porcupine Acquisition.�� | |||||||||||
| �� | |||||||||||
Q2 2025
- Revenue in Q2 2025 totaled
$142.0 million that resulted from gold sales of 42,550 ounces at an average realized gold price¹ of$3,337 per ounce. - EBITDA1,2 of $55.2 million compared to a loss before interest, taxes and depreciation and amortization of
$5.1 million and$6.3 million in Q2 2024 and Q1 2025, respectively. The significant improvement in EBITDA performance resulted from revenue and earnings generated from gold sales following completion of the Porcupine Acquisition on April 15, 2025. - Net earnings totaled
$5.5 million ($0.01 per basic share) versus a loss of$5.1 million ($0.01 per basic share) in Q2 2024 and net loss of$6.5 million ($0.02 per basic share) in Q1 2025. - Adjusted net earnings1��totaled
$28.4 million ($0.04 per basic share) versus adjusted net loss of$3.0 million ($0.01 per basic share) in Q2 2024 and adjusted net loss of$3.0 million ($0.01 per basic share) the previous quarter; The difference between net earnings and adjusted net earnings reflected the after-tax impact of$16.6 million of acquisition-related costs, mainly for legal, consulting and advisory services, and other expenses,$6.8 million of foreign exchange losses and$2.4 million of transition-related costs involving the Porcupine Operations. - Solid operating performance in initial quarter of production at Porcupine (April 16, 2025, to June 30, 2025):
- Production of 50,552 ounces, comprised of 16,112 ounces at Hoyle Pond, 27,286 ounces at Borden and 7,154 ounces at Pamour
- Gold poured totaling 46,608 ounces, with gold sales of 42,550 ounces
- Production costs of
$54.9 million - Operating cash costs1 averaging
$1,334 per ounce sold - All-in sustaining costs1 (��AISC��) averaging 2,123 per ounce sold; Site-level AISC averaging
$1,872 per ounce sold (see the Operating Cash Costs and AISC tables in Non-GAAP Measures section near the end of this press release for more information).
- Cash flows included net cash provided by operating activities of
$67.1 million , which compared to net used by operations activities of$8.5 million and$6.1 million in Q2 2024 and Q1 2025, respectively. - Free cash flow1 totaled
$27.3 million versus free cash flow of ($10.7) million in Q2 2024 and ($9.8) million in Q1 2025.
- Capital expenditures1 totaled
$44.2 million , with sustaining capital expenditures1 accounting for$16.1 million and growth capital expenditures1 totaling$28.1 million ; Sustaining capital expenditures largely focused on capital development at Hoyle Pond and Borden and construction work to raise and buttress the No. 6 tailings impoundment area (��TMA��), while the$28.1 million of growth capital expenditures related to pre-stripping at Pamour, with the remainder largely related to longer-term investments at the TMA.
| CAPITAL EXPENDITURES | �� | �� | �� | �� | �� | �� | �� | ||||||||
| $ thousands unless otherwise states | Hoyle Pond | Borden | Pamour | Porcupine1 | Cordero | Corporate | Total | �� | |||||||
| Sustaining | $- | $- | �� | ||||||||||||
| Growth | 1,854 | 2,665 | 22,338 | 26,857 | 1,196 | - | 28,053 | �� | |||||||
| Total | �� | ||||||||||||||
| 1. Capital expenditures incurred at Dome Mill and the TMA are allocated to Porcupine’s mining operations based on their proportion of mill fee provided to Dome Mill. | |||||||||||||||
| �� | |||||||||||||||
- Cash at June 30, 2025 totaled
$252.5 million reflecting approximately$475.0 million of gross proceeds ($468.7 million of net proceeds after share issue costs) from a financing package (the ��Financing Package��) arranged in conjunction with the Porcupine Acquisition, as well as$67.1 million of net cash from operating activities generated during Q2 2025, partially offset by$200.6 million of cash consideration paid for the Porcupine Operations at closing, the$44.2 million of capital expenditures during Q2 2025, as well as the impact of$51.6 million of restricted cash related to letters of credit and cash collateral for government required financial assurances in relation to closure plans involving the Porcupine assets.
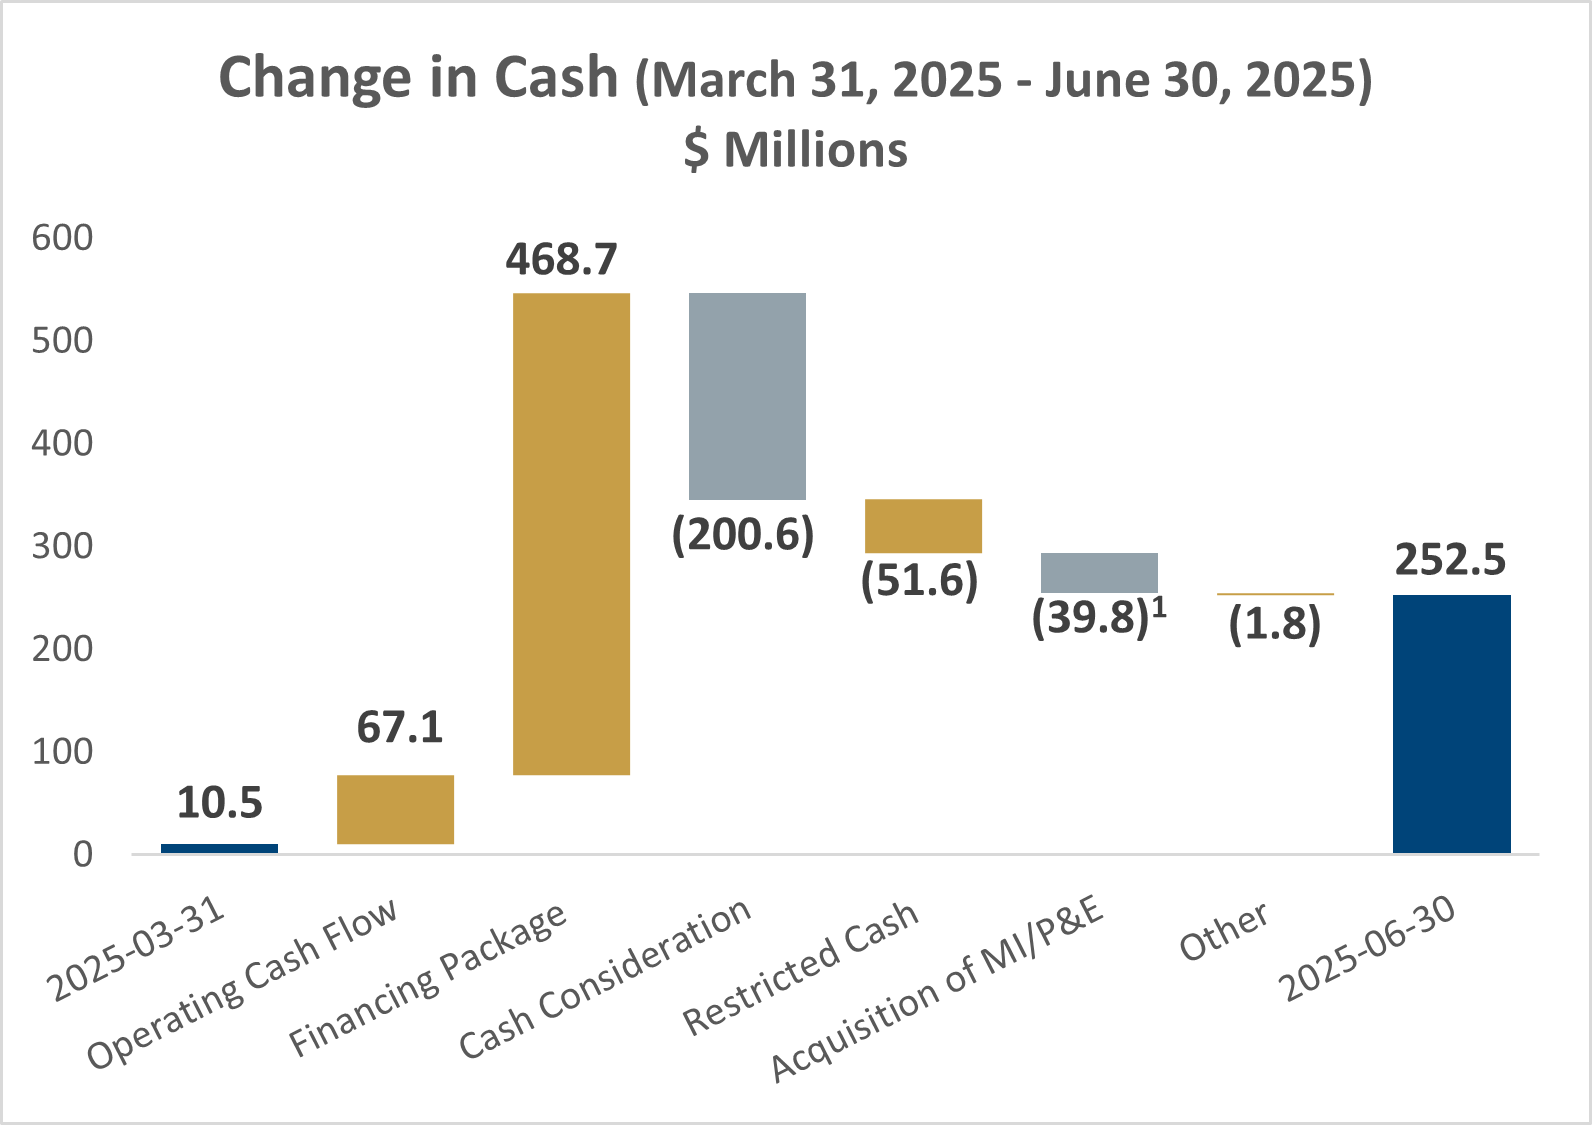
1. The difference between the
- Working capital1 at June 30, 2025, totaled
$225.9 million as compared to working capital of$17.0 million at December 31, 2024. The working capital balance at June 30, 2025, reflected the significant increase in cash during Q2 2025 as well as higher levels of short-term trade and other receivables and inventories, offset by higher current liabilities, mainly accounts payable and accrued liabilities, reclamation liabilities, deferred revenue, current income tax and employee-related benefits.
YTD 2025
Discovery did not generate revenue or earnings from mine operations in Q1 2025 or YTD 2024.
- Net loss for YTD 2025 totaled
$0.9 million , or$0.00 per basic share, compared to net loss of$5.6 million , or$0.01 per basic share, in YTD 2024. - Adjusted net earnings¹ and adjusted net earnings per basic share¹��were
$25.4 million and$0.04 , respectively, which compared to adjusted net loss and adjusted net loss per basic share of$4.5 million and$0.01 , respectively, in YTD 2024. The difference between net earnings and adjusted net earnings¹ in YTD 2025 mainly reflected the exclusion from adjusted net earnings of the after-tax impact of$20.2 million of business development expenses related to the Porcupine Acquisition,$6.7 million of foreign exchange losses, as well as$2.4 of one-time transition-related costs. - �������նٴ�¹,² for YTD 2025 totaled
$48.9 million versus a loss before interest, taxes and depreciation and amortization of$5.6 million in YTD 2024. The difference between net earnings and EBITDA mainly reflected the exclusion from EBITDA of$16.4 million of depletion and depreciation expense,$14.4 million of net finance costs, largely due to accretion expense from reclamation and deferred consideration and interest expense related to royalty agreements entered into with Franco-Nevada Corp. concurrent with the completion of the Porcupine Acquisition, and$19.0 million of income tax expense. - Net cash provided by operating activities in YTD 2025 totaled
$61.0 million , while free cash flow¹ totaled$17.5 million . - Total capital expenditures¹ for YTD 2025 totaled
$48.1 million , including$16.2 million of sustaining capital expenditures¹,$31.1 million of growth capital expenditures¹ and$0.8 million related to financial leases. Sustaining capital expenditures were incurred during Q2 2025 following the completion of the Porcupine Acquisition. Of growth capital expenditures in YTD 2025,$26.9 million related to Porcupine, with$4.2 million related to Cordero, largely for land acquisition during Q1 2025.
(1)����Example of Non-GAAP measure. See the section of this press release entitled, “NON-GAAP MEASURES�� for more information.
(2)����Refers to earnings before interest, taxes and depreciation and amortization.
| ��INCOME STATEMENT SUMMARY | �� | �� | |||||||||
| $ thousands unless otherwise states | Three months ended | �� | ����Six months ended | �� | |||||||
| �� | June 30, | June 30, | March 31 | June 30 | �� | �� | �� | ||||
| �� | �� | 2025 | �� | 2024 | �� | 2025 | �� | 2025 | �� | June 30, 2025 | �� |
| Revenue | $ | 142,010 | $ | - | $ | - | $ | 142,010 | $ | - | �� |
| �� | �� | �� | �� | �� | �� | �� | �� | �� | �� | �� | �� |
| Production costs�� | �� | 54,919 | �� | - | �� | - | �� | 54,919 | �� | - | �� |
| Depletion and amortization | �� | 16,384 | �� | - | �� | - | �� | 16,384 | �� | - | �� |
| Royalties | �� | 1,916 | �� | - | �� | - | �� | 1,916 | �� | - | �� |
| Earnings from mining operations | �� | 68,791 | �� | - | �� | - | �� | 68,791 | �� | - | �� |
| �� | �� | �� | �� | �� | �� | �� | �� | �� | �� | �� | �� |
| Expenses | �� | �� | �� | �� | �� | �� | �� | �� | �� | �� | �� |
| General and administration | �� | 22,877 | �� | 1,827 | �� | 5,474 | �� | 28,351 | �� | 3,641 | �� |
| Exploration | �� | 830 | �� | 103 | �� | 25 | �� | 855 | �� | 217 | �� |
| Share-based compensation | �� | 1,953 | �� | 692 | �� | 1,167 | �� | 3,120 | �� | 1,346 | �� |
| Earnings (loss) from operations | �� | 43,131 | �� | (2,622) | �� | (6,666) | �� | 36,465 | �� | (5,204) | �� |
| �� | �� | �� | �� | �� | �� | �� | �� | �� | �� | �� | �� |
| Other | �� | �� | �� | �� | �� | �� | �� | �� | �� | �� | �� |
| Other income (loss) | �� | (6,879) | �� | (3,012) | �� | 189 | �� | (6,690) | �� | (1,451) | �� |
| Finance items | �� | �� | �� | �� | �� | �� | �� | �� | �� | �� | �� |
| Finance income (cost), net | �� | (11,742) | �� | 496 | �� | 25 | �� | (11,717) | �� | 1,012 | �� |
| Earnings (loss) before taxes | �� | 24,510 | �� | (5,138) | �� | (6,452) | �� | 18,058 | �� | (5,643) | �� |
| Income taxes expense (recovery) | �� | 18,976 | �� | - | �� | - | �� | 18,976 | �� | - | �� |
| Net earnings (loss) | $ | 5,534 | $ | (5,138) | $ | (6,452) | $ | (918) | $ | (5,643) | �� |
| �� | �� | �� | �� | �� | �� | �� | �� | �� | �� | �� | �� |
| Basic earnings per share | $ | 0.01 | $ | (0.01) | $ | (0.02) | $ | (0.00) | $ | (0.01) | �� |
| Diluted earnings per share | $ | 0.01 | $ | (0.01) | $ | (0.02) | $ | (0.00) | $ | (0.01) | �� |
| �� | �� | �� | �� | �� | �� | �� | �� | �� | �� | �� | �� |
| Weighted average number of common shares outstanding (in 000’s) | �� | �� | �� | �� | �� | �� | �� | �� | �� | �� | �� |
| Basic | �� | 735,616 | �� | 397,570 | �� | 401,122 | �� | 569,293 | �� | 396,771 | �� |
| Diluted | �� | 762,923 | �� | 397,570 | �� | 411,049 | �� | 596,600 | �� | 396,771 | �� |
| �� | |||||||||||
PORCUPINE OPERATIONS REVIEW
Discovery’s Porcupine Operations cover approximately 1,400 km2 in and near Timmins, Ontario. Porcupine consists of the Hoyle Pond, Pamour and Hollinger mine properties, the Dome mine property and milling facility, and numerous near-mine and regional exploration targets. The Complex also includes the Borden mine property and large land position near Chapleau, Ontario. Current operations include the Hoyle Pond and Borden underground mines, with the Pamour open-pit project currently ramping up towards commercial levels of production. All mineralization from the operating mines, and Pamour, is processed at Dome, including mineralization from Borden, which is trucked 190 km to the Dome Mill.
DOME MILL
The current Dome Mill was commissioned in 1988, with expansion projects being completed in 1995 and 2004. The mill consists of three-stage crushing, two parallel rod mill and ball mill circuits, a single leach and Carbon-in-Pulp circuit, followed by a carbon strip and electrowinning circuit. The Mill’s nameplate operating capacity is approximately 12,000 tonnes per day (approximately 4.3 million tonnes per annum). In recent years, the mill has operated at rates well below capacity levels, largely reflecting increased maintenance requirements which contributed to reduced availability and utilization rates, as well as production shortfalls from mining operations. Through investment programs launched following the closing of the Porcupine Acquisition, the Company is targeting a return to full capacity operations by 2028 or sooner.
| �� | �� | Three months ended | �� |
| Dome Mill | �� | June 30, 2025 | �� |
| Total material milled (t) | �� | 508,791 | �� |
| Average Grade (g/t Au) | �� | 3.39 | �� |
| Recovery (%) | �� | �� | |
| Gold produced (oz) | �� | 50,552 | �� |
| Gold poured (oz) | �� | 46,608 | �� |
| Gold sold (oz) | �� | ��42,550 | �� |
| Milling operating costs ($ Millions) | $ | 12,861 | �� |
| Operating costs per tonne processed ($/tonne) | $ | 25.4 | �� |
| �� | �� | �� | �� |
For the period April 16, 2025, to June 30, 2025, a total of 508,791 tonnes were processed at Dome Mill at an average grade of 3.39 g/t, with recovery rates averaging
For the purpose of segment reporting, capital expenditures¹��for Dome Mill and the TMA are allocated to Hoyle Pond, Borden and Pamour based on a proportion of total tonnes processed basis. Capital expenditures allocated during Q2 2025 totaled
HOYLE POND
Hoyle Pond Mine is an underground gold mining operation located within the Archean Abitibi Greenstone Belt approximately 20 km northeast of downtown Timmins, Ontario. Underground infrastructure includes two decline ramps, an 815-metre four-compartment shaft (��#1 Shaft��) and a 1,350 metre winze (the ��#2 Winze��) with the deepest station being on the 1600-metre level. Underground production is trucked to the #2 Winze and is then hoisted to the 720 level, where it is sent by tram to the loading pocket of the #1 Shaft. Mineralization is then trucked approximately 17 km to Dome Mill. The mine began operations in 1985 and, since that time, has produced over 4.0 million ounces of gold.
| �� | �� | Three months ended | �� |
| Hoyle Pond | �� | ��June 30, 2025 | �� |
| Total material milled (t) | �� | 97,817 | �� |
| Average Grade (g/t Au) | �� | 5.50 | �� |
| Gold Contained (oz) | �� | 17,297 | �� |
| Recovery (%) | �� | �� | |
| Gold produced (oz) | �� | 16,112 | �� |
| Gold sold (oz) | �� | ��14,804 | �� |
| Development metres �� operating | �� | ��526 | �� |
| Development metres �� capital | �� | ��180 | �� |
| Production costs | $ | ��20,870 | �� |
| Operating cash costs per ounce sold1 | $ | ��1,566 | �� |
| AISC per ounce sold1 | $ | ��2,036 | �� |
| Total capital expenditures1 (in thousands) | $ | ��7,597 | �� |
| (1) Example of Non-GAAP measure. See the section in this press release entitled, “NON-GAAP MEASURES�� for more information. | �� | �� | �� |
| �� | �� | �� | �� |
Gold production at Hoyle Pond from April 16, 2025, to June 30, 2025, totaled 16,112 ounces, which resulted from 97,817 tonnes being processed at an average grade of 5.50 g/t and average recoveries of
Operating development metres during Q2 2025 were mainly focused on the main production areas in the Lower S Zone, as well as in areas of the Upper Mine, where production from narrow, high-grade veins is expected to commence during the second half of 2025. Capital development activities during the quarter mainly involved continuing to extend the main ramp to depth in the Lower S Zone.
Production costs, including mining and processing costs, in Q2 2025 totaled
BORDEN
Borden Mine is a ramp access underground mine located on a 1,000 km2 land position approximately 20 km east of Chapleau, Ontario. The deposit mine is located within the lower limb of an antiform in the Borden Lake Greenstone Belt. Production at Borden commenced in 2019 and, to date, approximately 600,000 ounces have been produced. Mining is carried out at Borden using the longhole stoping method with unconsolidated as well as cemented rock fill. Material is trucked from underground to surface and then from the mine site approximately 190 km to the Dome Mill.
| �� | Three months ended | �� | |
| Borden | June 30, 2025 | �� | |
| Total material milled (t) | �� | 166,609 | �� |
| Average Grade (g/t Au) | �� | ��5.62 | �� |
| Gold Contained (oz) | �� | ��30,118 | �� |
| Recovery (%) | �� | �� | |
| Gold produced (oz) | �� | ��27,286 | �� |
| Gold sold (oz) | �� | ��21,792 | �� |
| Development metres �� operating | �� | ��449 | �� |
| Development metres �� capital | �� | ��204 | �� |
| Production costs | $ | ��22,038 | �� |
| Operating cash costs per ounce sold1 | $ | ��1,175 | �� |
| AISC per ounce sold1 | $ | ��1,621 | �� |
| Total capital expenditures1 (in thousands) | $ | ��11,697 | �� |
| (1) Example of Non-GAAP measure. See the section in this press release entitled, “NON-GAAP MEASURES�� for more information. | �� | �� | �� |
| �� | �� | �� | �� |
Gold production at Borden from April 16, 2025, to June 30, 2025, totaled 27,286 ounces, which resulted from 166,609 tonnes being processed at an average grade of 5.62 g/t and average recoveries of
Operating development during the quarter was mainly focused on the West, Central and Upper East Zones, with capital development metres primarily related to the continued advancement of the main ramp and the exploration drift on the 575 level.
Production costs in Q2 2025 totaled
PAMOUR
Pamour mine, located approximately 20 km from downtown Timmins, first commenced underground mining in 1911 and was operated until 1996. Open-pit mining operations were initiated in 2006 and ceased in 2011. The project to re-develop and expand the Pamour open pit, and resume operations, commenced in 2023, with initial production achieved early in 2025 and project continuing to ramp up towards commercial production levels.��
| �� | �� | Three months ended | �� |
| Pamour | �� | June 30, 2025 | �� |
| Total material milled (t) | �� | 244,366 | �� |
| Average Grade (g/t Au) | �� | ��1.02 | �� |
| Gold Contained (oz) | �� | ��7,976 | �� |
| Recovery (%) | �� | �� | |
| Gold produced (oz) | �� | ��7,154 | �� |
| Gold sold (oz) | �� | ��6,051 | �� |
| Production costs | $ | ��12,011 | �� |
| Operating cash costs per ounce sold1 | $ | ��2,051 | �� |
| AISC per ounce sold1 | $ | ��2,194 | �� |
| Total capital expenditures1 (in thousands) | $ | ��22,338 | �� |
| (1) Example of Non-GAAP measure. See the section in this press release entitled, “NON-GAAP MEASURES�� for more information. | �� | �� | �� |
| �� | �� | �� | �� |
Gold production at Pamour from April 16, 2025, to June 30, 2025, totaled 7,154 ounces, which resulted from 244,366 tonnes being processed at an average grade of 1.02 g/t and average recoveries of
Production costs in Q2 2025 totaled
(1) Example of Non-GAAP measure. See the section in this press release entitled, “NON-GAAP MEASURES�� for more information.
CORDERO OVERVIEW
The Cordero Project was acquired by Discovery in 2019. Since that time, the Company has invested over a
Key highlights of the FS include:
- Average annual production of 37.0 million silver equivalent ounces (“AgEq��) over the first 12 years with a total project life of 19 years;
- All-in sustaining costs1 averaging below
$12.50 per AgEq ounce in Years 1 �� 8; - Base-case after-tax net present value (“NPV��) of
$1.2 billion (Base-case metal prices: Silver ��$22.00 per ounce; Gold ��$1,600 per ounce; Zinc ��$1.20 per ounce; Lead ��$1.00 per ounce); - Initial capital expenditures1 of
$606.0 million (resulting in a NPV to capital ratio of 2:1); - Large-scale Mineral Reserve totaling 302.0 million ounces of silver, 840,000 ounces of gold, 5.2 billion pounds of zine and 3.0 billion pounds of lead;
- Important socio-economic contribution to Mexico, including an initial investment of over
$600 million , the creation of 2,500 jobs during development, and over 1,000 jobs during operations,$4.0 billion in total procurement, all to remain within Mexico, and, assuming a fixed$35.00 per ounce silver price, total tax contributions within Mexico of$2.4 billion over the project life; and, - High levels of environmental responsibility and a commitment to contributing to the management of key social issues such as carbon reduction and water quality and availability.
Second Quarter 2025 Highlights
During Q2 2025, Discovery continued work on key initiatives to further de-risk the project, including:
- Assessing the potential to use natural gas power sources versus the grid power supply;
- Advancing geotechnical and other work related to the planned upgrade of the local water treatment plant; and,
- Evaluating the potential to establish solar farms around the project site to contribute to the power supply required for mine development and operation.
(1) Example of Non-GAAP measure. See the section in this press release entitled, “NON-GAAP MEASURES�� for more information.
OUTLOOK
With the closing of the Porcupine Acquisition on April 15, 2025, Discovery was transformed into a diversified North American-focused precious metals producer combining growing gold production in Northern Ontario, Canada, with one of the world’s largest silver development projects in Chihuahua State, Mexico. In Q2 2025, the Company commenced reporting gold production from the Hoyle Pond and Borden underground mines, as well as from the ramp up of gold production at the Pamour open-pit project.
Key priorities for the Porcupine Operations over the balance of 2025 include:
- Implementing investment plans aimed at growing mining rates, increasing production levels and lowering unit costs at Hoyle Pond and Borden;
- Ensuring the successful ramp up of production at Pamour;
- Advancing studies on the TVZ zone, Dome Mine project and Dome Mill expansion; and,
- Advancing numerous exploration opportunities at each of site, as well as at regional targets.
The Company is targeting a total of 140,000 metres of drilling in 2025. The goals for the drilling program include resource conversion at Hoyle Pond, Borden and Pamour, in support of establishing an initial reserve statement for the three mines during 2026. In addition, drilling will also target resource conversion at the Dome Mine as part of a study to update the Inferred Mineral Resource included in the technical report filed on SEDAR+ on January 28, 2025 entitled, “Porcupine Complex, Ontario, Canada, Technical Report on Preliminary Economic Assessment.�� The Company is also planning a drill program at the TVZ Zone with a goal of releasing an initial mineral resource in the first half of 2026.
As of the date of this press release, the Company is well capitalized to fund growth and optimization plans for Porcupine and current expenditure plans at Cordero with total cash of approximately
In Mexico, following release of the Cordero FS, the Company has conducted a limited work program aimed at further advancing and de-risking the Project, with key areas of focus being power, water availability and management, permitting, and continuation of ESG and community outreach programs.
Following the completion of the land acquisition program in March 2025, the next major milestone for the Cordero will be approval of the Company’s Environmental Impact Assessment or MIA by SEMARNAT, which was submitted in August 2023. The MIA passed SEMARNAT’s legal review soon after its submission and was advanced for technical review. As of the date of this, the Company had completed the technical review process and was awaiting approval of the MIA. The Company remains confident that Cordero will receive MIA approval.
ABOUT DISCOVERY
Discovery is a growing North American-focused precious metals company. The Company has exposure to silver through its first asset, the
On Behalf of the Board of Directors,
Tony Makuch, P.Eng
President, CEO & Director
For further information contact:
Mark Utting, CFA
SVP Investor Relations
Phone: 416-806-6298
Email: Website:
QUALIFIED PERSON
The scientific and technical information in this press release was reviewed and approved by Pierre Rocque, P.Eng., Chief Operating Officer of the Company and Eric Kallio, P.Geo., Senior Vice President, Exploration of the Company, who are recognized as a Qualified Persons (“QPs��) under the guidelines of National Instrument 43-101 �� Standards of Disclosure for Mineral Projects (“NI 43-101��).
NON-GAAP MEASURES
The Company has included certain non-GAAP measures in this press release, as detailed below. In the mining industry, these are common performance measures and ratios but may not be comparable to similar measures or ratios presented by other issuers and the non-GAAP measures and ratios do not have any standardized meaning. Accordingly, these measures and ratios are included to provide additional information and should not be considered in isolation or as a substitute for measures of performance prepared in accordance with IFRS Accounting Standards. These measures do not have any standardized meaning prescribed under IFRS and therefore may not be comparable to other issuers.
Free Cash Flow
Free Cash Flow is a non-GAAP performance measure that is calculated as cash flows from operations net of cash flows invested in mineral property, plant, and equipment and exploration and evaluation assets. The Company believes that this measure is useful to the external users in assessing the Company’s ability to generate cash flow after capital investments and build the cash resources of the Company.
Free cash flow is reconciled to the amounts include in the Consolidated Statements of Cash Flows as follows:
| �� | Three months ended | �� | �� | �� | Six months ended | �� | |||||
| �� | June 30, | June 30, | March 31 | June 30 | �� | June 30, | �� | ||||
| �� | �� | 2025 | �� | 2024 | �� | 2025 | �� | 2025 | �� | 2025 | �� |
| Net cash provided by operating activities | $ | 67,081 | $ | (8,543) | $ | (6,075) | $ | 61,005 | $ | (11,014) | �� |
| Acquisition of mineral interests, plant and equipment | �� | (39,766) | �� | (2,141) | �� | (3,767) | �� | (43,533) | �� | (5,448) | �� |
| Free cash flow | $ | 27,315 | $ | (10,684) | $ | (9,842) | $ | 17,472 | $ | (16,462) | �� |
| �� | |||||||||||
Sustaining and Growth Capital
Sustaining capital and growth capital are non-GAAP measures. Sustaining capital is defined as capital required to maintain current operations at existing levels. Growth capital is defined as capital expenditures for major growth projects or enhancement capital for significant infrastructure improvements at existing operations. Both measurements are used by management to assess the effectiveness of investment programs.
| �� | Three months ended | Six months ended | �� | ||||||||
| �� | June 30, | June 30, | March 31 | June 30 | June 30, | �� | |||||
| �� | �� | 2025 | �� | 2024 | �� | 2025 | �� | 2025 | �� | 2025 | �� |
| Sustaining capital | $ | 16,122 | $ | - | $ | 36 | $ | 16,158 | $ | - | �� |
| Growth capital | �� | 28,053 | �� | 1,935 | �� | 3,092 | �� | 31,145 | �� | 5,563 | �� |
| Finance leases related to IFRS 16 | �� | 35 | �� | - | �� | 735 | �� | 771 | �� | - | �� |
| Total capital expenditures | $ | 44,211 | $ | 1,935 | $ | 3,863 | $ | 48,074 | $ | 5,563 | �� |
| �� | �� | �� | �� | �� | �� | �� | �� | �� | �� | �� | �� |
Operating Cash Costs and Operating Cash Costs per Ounce Sold
Operating cash costs and operating cash costs per tonne and per ounce sold are non-GAAP measures. In the gold mining industry, these metrics are common performance measures but do not have any standardized meaning under GAAP. Operating cash costs include mine site operating costs such as mining, processing, administration and royalty expenses but exclude depreciation and depletion and reclamation costs. Operating cash cost per ounce sold is based on ounces sold and is calculated by dividing operating cash costs by volume of gold ounces sold.
The Company discloses operating cash costs and operating cash cost per tonne and per ounce as it believes the measures provide valuable assistance to investors and analysts in evaluating the Company’s operational performance and ability to generate cash flow. The most directly comparable measure prepared in accordance with GAAP is total production costs. Operating cash costs and operating cash costs per ounce of gold should not be considered in isolation or as a substitute for measures prepared in accordance with GAAP.
AISC and AISC per Ounce Sold
AISC and AISC per ounce are non-GAAP measures. These measures are intended to assist readers in evaluating the total costs of producing gold from current operations. While there is no standardized meaning across the industry for this measure, the Company’s definition conforms to the definition of AISC as set out by the World Gold Council in its guidance note dated June 27, 2013.
The Company defines AISC as the sum of operating costs (as defined and calculated above), sustaining capital, exploration expense, corporate expenses, lease payments relating to sustaining assets, and reclamation cost accretion and depreciation related to current operations. Corporate expenses include general and administrative expenses, net of transaction related costs, severance expenses for management changes and interest income. AISC excludes growth capital expenditures, growth exploration expenditures, reclamation cost accretion and depreciation not related to current operations, lease payments related to non-sustaining assets, interest expense, debt repayment and taxes.
Operating cash costs and AISC Reconciliation
The following tables reconciles these non-GAAP measures to the most directly comparable GAAP measures available for the three and six months ended June 30, 2025, and 2024:
| �� $ Thousands unless otherwise stated | Hoyle | Borden | Porcupine (Excl. Pamour) | Corporate | Total Consolidated | Pamour | �� |
| Production costs | 20,870 | 22,038 | 42,908 | - | ��42,908 | 12,011 | �� |
| Royalty expense | 667 | 981 | 1,648 | - | ��1,648 | 268 | �� |
| Franco NSR | 2,295 | 3,378 | 5,673 | - | ��5,673 | 923 | �� |
| One-time TSA | (644) | (783) | (1,427) | - | ��(1,427) | (989) | �� |
| Operating cash costs | 23,188 | 25,614 | 48,802 | - | ��48,802 | 12,213 | �� |
| General and administrative1 | - | - | - | 5,832 | ��5,832 | - | �� |
| Share-based compensation | - | - | - | 1,953 | ��1,953 | - | �� |
| Accretion of site closure provisions | 553 | 673 | 1,226 | - | 1,226 | 850 | �� |
| Amortization of site closure provision | - | - | 3,063 | - | ��3,063 | - | �� |
| Sustaining capital | 5,743 | 9,032 | 14,775 | 1,347 | ��16,122 | - | �� |
| Expensed exploration | 659 | - | 659 | - | ��659 | - | �� |
| Sustaining leases | - | - | - | 21 | ��21 | - | �� |
| AISC | 30,143 | 35,319 | 68,525 | 9,153 | ��77,678 | 13,063 | �� |
| Ounces of gold sold | 14,804 | 21,792 | 36,596 | - | ��36,596 | 5,954 | �� |
| Operating cash costs per ounce sold ($) | 1,566 | 1,175 | 1,334 | - | ��1,334 | 2,051 | �� |
| Sustaining capital expenditures per ounce sold ($) | 388 | 414 | 404 | - | ��441 | - | �� |
| AISC per ounce sold ($) | 2,036 | 1,621 | 1,872 | - | ��2,123 | 2,194 | �� |
| (1)����Excludes certain non-recurring items not reflective of normal operations. | |||||||
| �� | |||||||
Average AG���˹ٷ�ized Price per Ounce Sold
In the gold mining industry, average realized price per ounce sold is a common performance measure that does not have any standardized meaning. The most directly comparable measure prepared in accordance with GAAP is revenue from gold sales. Average realized price per ounces sold should not be considered in isolation or as a substitute for measures prepared in accordance with GAAP. The measure is intended to assist readers in evaluating the total revenues realized in a period from current operations.
| �� | �� | Three months ended | �� | ||||
| �� | June 30, | June 30, | �� | March 31 | �� | ||
| $ Thousands unless otherwise indicated | �� | 2025 | �� | 2024 | �� | 2025 | �� |
| Revenue | $ | 142,010 | $ | - | $ | - | �� |
| Ounces sold�� | �� | 42,550 | �� | - | �� | - | �� |
| Average realized price per ounce sold ($) | $ | 3,337 | $ | - | $ | - | �� |
| �� | �� | �� | �� | �� | �� | �� | �� |
Adjusted Net Earnings and Adjusted Net Earnings per Share
Adjusted net earnings and adjusted net earnings per share are used by management and investors to measure the underlying operating performance of the Company. Adjusted net earnings is defined as net earnings adjusted to exclude the after-tax impact of specific items that are significant, but not reflective of the underlying operations of the Company, including foreign exchange gains and losses and other non-recurring items. Adjusted net earnings per share is calculated using the weighted average number of shares outstanding for adjusted net earnings per share.
| �� | Three months ended | Six months ended | �� | ||||||||
| �� | June 30, | June 30, | March 31 | June 30 | June 30, | �� | |||||
| $ Thousands unless otherwise indicated | �� | 2025 | �� | 2024 | �� | 2025 | �� | 2025 | �� | 2025 | �� |
| Net earnings | $ | 5,534 | $ | (5,138) | $ | (6,452) | $ | (918) | $ | (5,643) | �� |
| Business development expenses | �� | 16,619 | �� | 79 | �� | 3,534 | �� | 20,153 | �� | 79 | �� |
| Foreign exchange loss (gain) | �� | 6,821 | �� | 2,952 | �� | (128) | �� | 6,693 | �� | 1,486 | �� |
| One-time TSA | �� | 2,416 | �� | - | �� | - | �� | 2,416 | �� | - | �� |
| Income tax related to above adjustments | �� | (2,956) | �� | - | �� | - | �� | (2,956) | �� | - | �� |
| Adjusted net earnings | $ | 28,434 | $ | (2,107) | $ | (3,046) | $ | 25,388 | $ | (4,078) | �� |
| Weighted average shares outstanding �� basic (��000s) | �� | �� 735,616 | �� | 397,570 | �� | 401,122 | �� | �� 569,293 | �� | 396,771 | �� |
| Adjusted net earnings per share ($) | $ | 0.04 | $ | (0.01) | $ | (0.01) | $ | 0.04 | $ | (0.01) | �� |
| �� | �� | �� | �� | �� | �� | �� | �� | �� | �� | �� | �� |
Earnings before Interest, Taxes, Depreciation, and Amortization (“EBITDA��)
EBITDA represents net earnings before interest, taxes, depreciation and amortization. EBITDA is an indicator of the Company’s ability to generate liquidity by producing operating cash flow to fund working capital needs, service debt obligations, and fund capital expenditures.
The following is a reconciliation of EBITDA to the consolidated financial statements:
| �� | Three months ended | �� | Six months ended | �� | |||||||
| �� | June 30, | June 30, | March 31 | June 30 | �� | June 30, | �� | ||||
| �� | �� | 2025 | �� | 2024 | �� | 2025 | �� | 2025 | �� | 2025 | �� |
| Net earnings | $ | 5,534 | $ | (5,138) | $ | (6,452) | $ | (918) | $ | (5,643) | �� |
| Add back: | �� | �� | �� | �� | �� | �� | �� | �� | �� | �� | �� |
| Finance costs | �� | 14,307 | �� | 3 | �� | 126 | �� | 14,433 | �� | 6 | �� |
| Depletion and depreciation | �� | 16,384 | �� | - | �� | - | �� | 16,384 | �� | - | �� |
| Income tax expenses (recovery) | �� | 18,976 | �� | - | �� | - | �� | 18,976 | �� | - | �� |
| EBITDA | $ | 55,201 | $ | (5,135) | $ | (6,326) | $ | 48,875 | $ | (5,637) | �� |
| �� | �� | �� | �� | �� | �� | �� | �� | �� | �� | �� | �� |
Working Capital
Working capital is a non-GAAP measure. In the gold mining industry, working capital is a common measure of liquidity, but does not have any standardized meaning. The most directly comparable measure prepared in accordance with GAAP is current assets and current liabilities. Working capital is calculated by deducting current liabilities from current assets. Working capital should not be considered in isolation or as a substitute for measures prepared in accordance with GAAP. The measure is intended to assist readers in evaluating the Company’s liquidity. Working capital is reconciled to the amounts in the Consolidated Statements of Financial Position as follows:
| �� | As at June 30 | �� | As at December 31, | �� | |
| �� | �� | 2025 | �� | 2024 | �� |
| Current assets | $ | 393,007 | $ | 22,937 | �� |
| Current liabilities | �� | 167,123 | �� | 5,984 | �� |
| Working capital | $ | 225,884 | $ | 16,953 | �� |
| �� | �� | �� | �� | �� | �� |
FORWARD-LOOKING STATEMENTS
Neither TSX Exchange nor its Regulation Services Provider (as that term is defined in the policies of the TSX Exchange) accepts responsibility for the adequacy or accuracy of this release.
This news release is not for distribution to United States newswire services or for dissemination in the United States.
This news release does not constitute an offer to sell or a solicitation of an offer to buy nor shall there be any sale of any of the securities in any jurisdiction in which such offer, solicitation or sale would be unlawful, including any of the securities in the United States of America. The securities have not been and will not be registered under the United States Securities Act of 1933, as amended (the ��1933 Act��) or any state securities laws and may not be offered or sold within the United States or to, or for account or benefit of, U.S. Persons (as defined in Regulation S under the 1933 Act) unless registered under the 1933 Act and applicable state securities laws, or an exemption from such registration requirements is available.
Cautionary Note Regarding Forward-Looking Statements
This news release may include forward-looking statements that are subject to inherent risks and uncertainties. All statements within this news release, other than statements of historical fact, are to be considered forward looking. Although Discovery believes the expectations expressed in such forward-looking statements are based on reasonable assumptions, such statements are not guarantees of future performance and actual results or developments may differ materially from those described in forward-looking statements. Statements include but are not limited to the development of the Porcupine Operations and its attractive economics and significant exploration upside; construction decision and development, the results of the Technical Report and the anticipated capital and operating costs, sustaining costs, net present value, internal rate of return, the method of mining the Porcupine Operations, payback period, process capacity, average annual metal production, average process recoveries, concession renewal, permitting of the assets, anticipated mining and processing methods, feasibility study production schedule and metal production profile, anticipated construction period, anticipated mine life, expected recoveries and grades, anticipated production rates, infrastructure, social and environmental impact studies, the completion of key de-risking items, including the timing of receipt permits, availability of water and power, availability of labour, job creation and other local economic benefits, tax rates and commodity prices that would support development of the Cordero Project, and other statements that express management's expectations or estimates of future performance, operational, geological or financial results Information concerning mineral resource/reserve estimates and the economic analysis thereof contained in the results of the feasibility study are also forward-looking statements in that they reflect a prediction of the mineralization that would be encountered, and the results of mining, if a mineral deposit were developed and mined. Forward-looking statements are statements that are not historical facts which address events, results, outcomes or developments that the Company expects to occur. Forward-looking statements are based on the beliefs, estimates and opinions of the Company’s management on the date the statements are made and they involve a number of risks and uncertainties.
Factors that could cause actual results to differ materially from those described in forward-looking statements include fluctuations in market prices, including metal prices, continued availability of capital and financing, and general economic, market access restrictions or tariffs, changes in U.S. laws and policies regarding regulating international trade, including but not limited to changes to or implementation of tariffs, trade restrictions, or responsive measures of foreign and domestic governments, changes to cost and availability of goods and raw materials, along with supply, logistics and transportation constraints, changes in general economic conditions including market volatility due to uncertain trade policies and tariffs, , the actual results of current and future exploration activities; changes to current estimates of mineral reserves and mineral resources; conclusions of economic and geological evaluations; changes in project parameters as plans continue to be refined; the speculative nature of mineral exploration and development; risks in obtaining and maintaining necessary licenses, permits and authorizations for the Company’s development stage and operating assets; the accuracy of historical and forward-looking operational and financial information estimates provided by Newmont; the Company’s ability to integrate the Porcupine Operations; statements regarding the Porcupine Operations, including the results of technical studies and the anticipated capital and operating costs, sustaining costs , internal rate of return, concession or claim renewal, the projected mine life and other attributes of the Porcupine Operations, including net present value, the timing of any environmental assessment processes, reclamation obligations; operations may be exposed to new diseases, epidemics and pandemics, including any ongoing or future effects of COVID-19 (and any related ongoing or future regulatory or government responses) and its impact on the broader market and the trading price of the Company’s shares; provincial and federal orders or mandates (including with respect to mining operations generally or auxiliary businesses or services required for operations) in Canada and Mexico, all of which may affect many aspects of the Company's operations including the ability to transport personnel to and from site, contractor and supply availability and the ability to sell or deliver mined silver; changes in national and local government legislation, controls or regulations; failure to comply with environmental and health and safety laws and regulations; labour and contractor availability (and being able to secure the same on favourable terms); disruptions in the maintenance or provision of required infrastructure and information technology systems; fluctuations in the price of gold or certain other commodities such as, diesel fuel, natural gas, and electricity; operating or technical difficulties in connection with mining or development activities, including geotechnical challenges and changes to production estimates (which assume accuracy of projected ore grade, mining rates, recovery timing and recovery rate estimates and may be impacted by unscheduled maintenance); changes in foreign exchange rates (particularly the Canadian dollar, U.S. dollar and Mexican peso); the impact of inflation; geopolitical conflicts; employee and community relations; the impact of litigation and administrative proceedings (including but not limited to mining reform laws in Mexico, or litigations involving First Nation(s)) and any interim or final court, arbitral and/or administrative decisions; disruptions affecting operations; availability of and increased costs associated with mining inputs and labour; delays in construction decisions and any development of the Cordero Project or other projects at the Porcupine Operations; changes with respect to the intended method of mining and processing ore from the Porcupine Operations; inherent risks and hazards associated with mining and mineral processing including environmental hazards, industrial accidents, unusual or unexpected formations, pressures and cave-ins; the risk that the Company’s mines may not perform as planned; uncertainty with the Company's ability to secure additional capital to execute its business plans; contests over title to properties; expropriation +or nationalization of property; political or economic developments in Canada and Mexico and other jurisdictions in which the Company may carry on business in the future; increased costs and risks related to the potential impact of climate change, including risks associated with increased frequency of natural disasters such as fire, floods and seismicity; the costs and timing of exploration, construction and development of new deposits; risk of loss due to sabotage, protests and other civil disturbances; the impact of global liquidity and credit availability and the values of assets and liabilities based on projected future cash flows; risks arising from holding derivative instruments; and business opportunities that may be pursued by the Company. There can be no assurances that such statements will prove accurate and, therefore, readers are advised to rely on their own evaluation of such uncertainties. Discovery does not assume any obligation to update any forward-looking statements except as required under applicable laws. The risks and uncertainties that may affect forward-looking statements, or the material factors or assumptions used to develop such forward-looking information, are described under the heading "Risks Factors" in the Company’s Annual Information Form dated March 26, 2025, which is available under the Company’s issuer profile on SEDAR+ at .
An infographic accompanying this announcement is available at
