Health Catalyst Reports Second Quarter 2025 Results
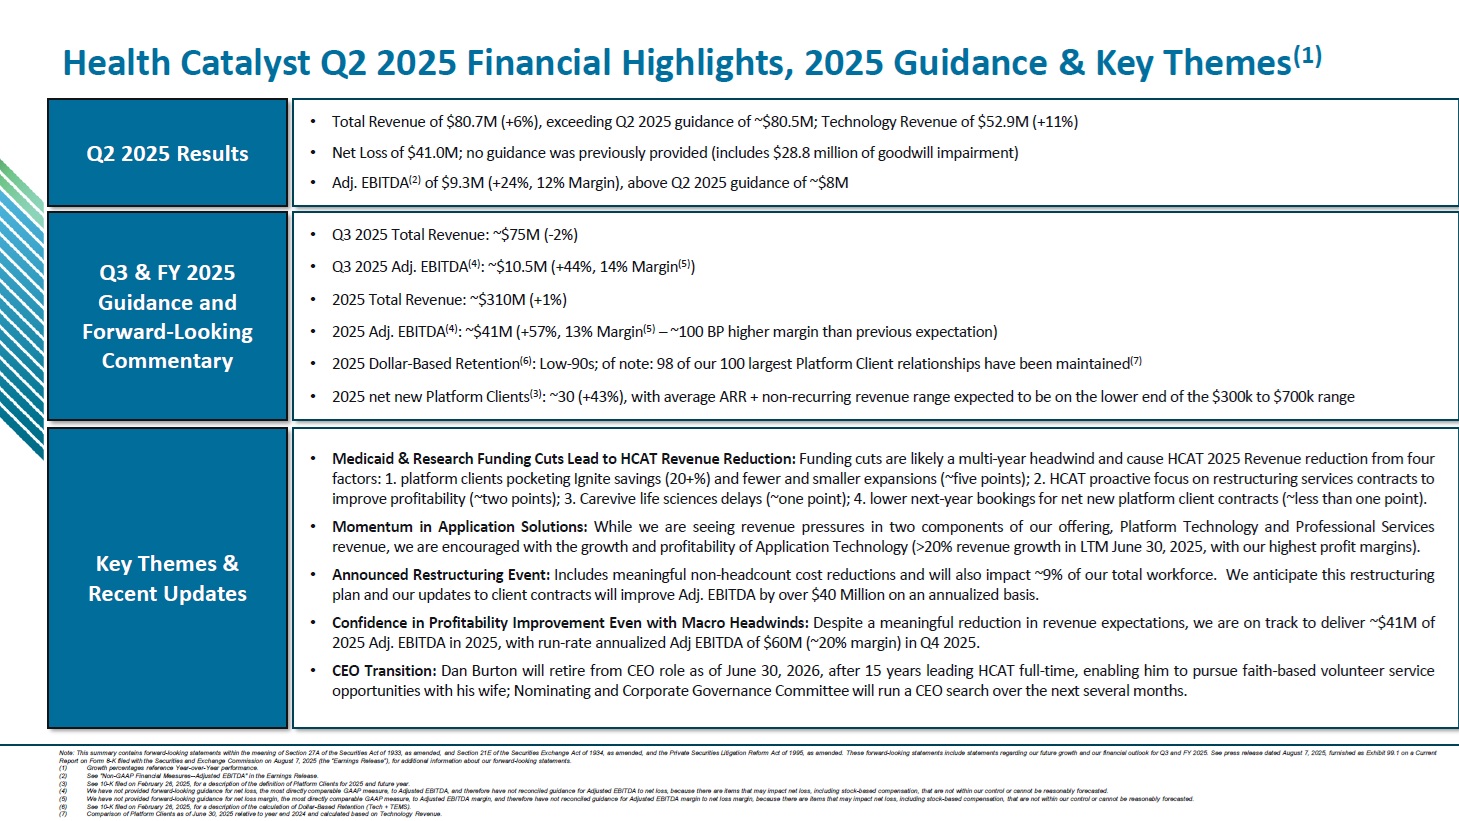
Health Catalyst (Nasdaq: HCAT) reported strong Q2 2025 financial results, with total revenue of $80.7 million (up 6% YoY) and Adjusted EBITDA of $9.3 million (up 24% YoY), exceeding quarterly guidance. The company maintained a gross margin of 38% and an Adjusted Gross Margin of 50%.
CEO Dan Burton announced his planned retirement effective June 30, 2026, after 15 years of leadership. The Board will conduct a CEO search, with Burton continuing to serve on the Board post-retirement.
For Q3 2025, Health Catalyst expects revenue of approximately $75 million and Adjusted EBITDA of $10.5 million. Full-year 2025 guidance projects revenue of $310 million and Adjusted EBITDA of $41 million.
Health Catalyst (Nasdaq: HCAT) ha riportato solidi risultati finanziari per il secondo trimestre 2025, con un fatturato totale di 80,7 milioni di dollari (in aumento del 6% su base annua) e un EBITDA rettificato di 9,3 milioni di dollari (in crescita del 24% su base annua), superando le previsioni trimestrali. L'azienda ha mantenuto un margine lordo del 38% e un Margine Lordo Rettificato del 50%.
Il CEO Dan Burton ha annunciato il suo pensionamento previsto per il 30 giugno 2026, dopo 15 anni di leadership. Il Consiglio di Amministrazione avvierà la ricerca di un nuovo CEO, mentre Burton continuerà a far parte del Consiglio dopo il pensionamento.
Per il terzo trimestre 2025, Health Catalyst prevede un fatturato di circa 75 milioni di dollari e un EBITDA rettificato di 10,5 milioni di dollari. Le previsioni per l'intero anno 2025 stimano un fatturato di 310 milioni di dollari e un EBITDA rettificato di 41 milioni di dollari.
Health Catalyst (Nasdaq: HCAT) reportó sólidos resultados financieros en el segundo trimestre de 2025, con ingresos totales de 80,7 millones de dólares (un aumento del 6% interanual) y un EBITDA ajustado de 9,3 millones de dólares (un crecimiento del 24% interanual), superando las previsiones trimestrales. La compañía mantuvo un margen bruto del 38% y un Margen Bruto Ajustado del 50%.
El CEO Dan Burton anunció su retiro planificado para el 30 de junio de 2026, tras 15 años de liderazgo. La Junta Directiva llevará a cabo la búsqueda de un nuevo CEO, mientras Burton continuará formando parte de la Junta después de su retiro.
Para el tercer trimestre de 2025, Health Catalyst espera ingresos de aproximadamente 75 millones de dólares y un EBITDA ajustado de 10,5 millones de dólares. Las previsiones para todo el año 2025 proyectan ingresos de 310 millones de dólares y un EBITDA ajustado de 41 millones de dólares.
Health Catalyst (나스��: HCAT)�� 2025�� 2분기 강력�� 재무 실적�� 보고했으��, �� 매출 8,070�� 달러(전년 대�� 6% 증가)와 조정 EBITDA 930�� 달러(전년 대�� 24% 증가)�� 기록하여 분기 가이던스를 초과 달성했습니다. 회사�� �� 마진 38%�� 조정 �� 마진 50%�� 유지했습니다.
CEO Dan Burton은 15년간�� 리더십을 마치�� 2026�� 6�� 30일자�� 은퇴할 계획임을 발표했습니다. 이사회는 신임 CEO�� 찾는 절차�� 진행�� 예정이며, Burton은 은�� 후에�� 이사회에 남아 활동�� 것입니다.
2025�� 3분기에는 �� 7,500�� 달러�� 매출�� 1,050�� 달러�� 조정 EBITDA�� 예상합니��. 2025�� 전체 가이던스는 3�� 1,000�� 달러�� 매출�� 4,100�� 달러�� 조정 EBITDA�� 전망합니��.
Health Catalyst (Nasdaq : HCAT) a annoncé de solides résultats financiers pour le deuxième trimestre 2025, avec un chiffre d'affaires total de 80,7 millions de dollars (en hausse de 6 % en glissement annuel) et un EBITDA ajusté de 9,3 millions de dollars (en progression de 24 % en glissement annuel), dépassant les prévisions trimestrielles. La société a maintenu une marge brute de 38 % et une marge brute ajustée de 50 %.
Le PDG Dan Burton a annoncé sa retraite prévue pour le 30 juin 2026, après 15 ans à la tête de l'entreprise. Le conseil d'administration mènera une recherche pour un nouveau PDG, Burton continuant à siéger au conseil après sa retraite.
Pour le troisième trimestre 2025, Health Catalyst prévoit un chiffre d'affaires d'environ 75 millions de dollars et un EBITDA ajusté de 10,5 millions de dollars. Les prévisions pour l'ensemble de l'année 2025 projettent un chiffre d'affaires de 310 millions de dollars et un EBITDA ajusté de 41 millions de dollars.
Health Catalyst (Nasdaq: HCAT) meldete starke Finanzergebnisse für das zweite Quartal 2025 mit einem Gesamtumsatz von 80,7 Millionen US-Dollar (ein Anstieg von 6 % im Jahresvergleich) und einem bereinigten EBITDA von 9,3 Millionen US-Dollar (ein Anstieg von 24 % im Jahresvergleich), womit die Quartalsprognosen übertroffen wurden. Das Unternehmen hielt eine Bruttomarge von 38 % und eine bereinigte Bruttomarge von 50 % aufrecht.
CEO Dan Burton kündigte seinen geplanten Rücktritt zum 30. Juni 2026 nach 15 Jahren Führung an. Der Vorstand wird eine Suche nach einem neuen CEO durchführen, wobei Burton nach seinem Rücktritt weiterhin im Vorstand tätig sein wird.
Für das dritte Quartal 2025 erwartet Health Catalyst einen Umsatz von etwa 75 Millionen US-Dollar und ein bereinigtes EBITDA von 10,5 Millionen US-Dollar. Die Prognose für das Gesamtjahr 2025 sieht einen Umsatz von 310 Millionen US-Dollar und ein bereinigtes EBITDA von 41 Millionen US-Dollar vor.
- Revenue grew 6% year-over-year to $80.7 million
- Adjusted EBITDA increased 24% year-over-year to $9.3 million
- Q2 results exceeded quarterly guidance
- Strong full-year guidance with projected revenue of $310 million
- Net loss widened significantly to $41 million, up 203% year-over-year
- CEO Dan Burton announcing retirement could create leadership uncertainty
- Q3 2025 revenue guidance of $75 million shows sequential decline from Q2
Insights
HCAT reports solid Q2 growth with 6% revenue increase and 24% Adjusted EBITDA improvement, despite widening net losses.
Health Catalyst delivered $80.7 million in Q2 revenue, representing a
However, the net loss significantly widened to
The company's adjusted gross margin held steady at
CEO Dan Burton's planned retirement in June 2026 adds a governance dimension to consider. While the lengthy transition period (nearly a year) provides stability, leadership transitions always carry execution risk. The board's active involvement in the succession planning process is a positive governance signal, and Burton's continued board participation should help maintain strategic continuity through the transition.
SALT LAKE CITY, Aug. 07, 2025 (GLOBE NEWSWIRE) -- Health Catalyst, Inc. (“Health Catalyst,�� Nasdaq: HCAT), a leading provider of data and analytics technology and services to healthcare organizations, today reported financial results for the quarter ended June��30, 2025.
“For the second quarter of 2025, I am pleased by our strong financial results, including total revenue of
Jack Kane, Chairman of the Health Catalyst Board of Directors, added “We as a Board would like to thank Dan for his many years of outstanding service to the company in the role of CEO. We fully support Dan in pursuing these opportunities and we appreciate the time he is giving us as a Board to manage an effective and orderly transition. We are grateful Dan will continue to serve on the Board. Our Nominating and Corporate Governance Committee will conduct a CEO search to identify an effective, world-class CEO to lead Health Catalyst in its next chapter.��
Financial Highlights for the Three Months Ended June 30, 2025
Key Financial Metrics
| �� | Three Months Ended June 30, | �� | Year over Year���� | |||||||||
| �� | �� | 2025 | �� | �� | �� | 2024 | �� | �� | ��Change | |||
| GAAP Financial Measures: | (in thousands, except percentages, unaudited) | |||||||||||
| Total revenue | $ | 80,721 | �� | �� | $ | 75,902 | �� | �� | 6 | % | ||
| Gross profit | $ | 30,333 | �� | �� | $ | 28,806 | �� | �� | 5 | % | ||
| Gross margin | �� | 38 | % | �� | �� | 38 | % | �� | �� | |||
| Net loss | $ | (40,978 | ) | �� | $ | (13,516 | ) | �� | (203 | )% | ||
| Non-GAAP Financial Measures:(1) | �� | �� | �� | �� | �� | |||||||
| Adjusted Gross Profit | $ | 39,964 | �� | �� | $ | 37,803 | �� | �� | 6 | % | ||
| Adjusted Gross Margin | �� | 50 | % | �� | �� | 50 | % | �� | �� | |||
| Adjusted EBITDA | $ | 9,344 | �� | �� | $ | 7,522 | �� | �� | 24 | % | ||
________________________
(1) These measures are not calculated in accordance with generally accepted accounting principles in the United States (GAAP). See the accompanying "Non-GAAP Financial Measures" section below for more information about these financial measures, including the limitations of such measures, and for a reconciliation of each measure to the most directly comparable measure calculated in accordance with GAAP.
Financial Outlook
Health Catalyst provides forward-looking guidance on total revenue, a GAAP measure, and Adjusted EBITDA, a non-GAAP measure.
For the third quarter of 2025, we expect:
- Total revenue of approximately
$75 million , and - Adjusted EBITDA of approximately
$10.5 million
For the full year of 2025, we expect:
- Total revenue of approximately
$310 million , and - Adjusted EBITDA of approximately
$41 million
We have not provided forward-looking guidance for net loss, the most directly comparable GAAP measure to Adjusted EBITDA, and therefore have not reconciled guidance for Adjusted EBITDA to net loss, because there are items that may impact net loss, including stock-based compensation, that are not within our control or cannot be reasonably forecasted.
Quarterly Conference Call Details
We will host a conference call to review the results today, Thursday, August��7, 2025, at 5:00 p.m. E.T. The conference call can be accessed by dialing (800) 343-5172 for U.S. participants, or (203) 518-9856 for international participants, and referencing conference ID “HCATQ225.�� A live audio webcast will be available online at . A replay of the call will be available via webcast for on-demand listening shortly after the completion of the call, at the same web link, and will remain available for approximately 90 days.
About Health Catalyst
Health Catalyst (Nasdaq: HCAT) is a leading provider of data and analytics technology and services that ignite smarter healthcare, lighting the path to measurable clinical, financial, and operational improvement. More than 1,000 organizations worldwide rely on Health Catalyst's offerings, including our cloud-based technology ecosystem Health Catalyst Ignite��, AI-enabled data and analytics solutions, and expert services to drive meaningful outcomes across hundreds of millions of patient records. Powered by high-value data, standardized measures and registries, and deep healthcare domain expertise, Ignite helps organizations transform complex information into actionable insights. Backed by a multi-decade mission and a proven track record of delivering billions of dollars in measurable results, Health Catalyst continues to serve as the catalyst for massive, measurable, data-informed healthcare improvement and innovation.
Available Information
Our investors and others should note that we announce material information to the public about our company, products and services, and other matters related to our company through a variety of means, including our website (https://www.healthcatalyst.com/), our investor relations website (), press releases, SEC filings, public conference calls, and social media, including our and our CEO's social media accounts such as LinkedIn (��and ), in order to achieve broad, non-exclusionary distribution of information to the public and to comply with our disclosure obligations under Regulation FD.
Forward-Looking Statements
This release contains forward-looking statements within the meaning of Section 27A of the Securities Act of 1933, as amended, and Section 21E of the Securities Exchange Act of 1934, as amended, and the Private Securities Litigation Reform Act of 1995, as amended. These forward-looking statements include statements regarding our future growth and our financial outlook for the third quarter and full year 2025 and our CEO retirement and transition. Forward-looking statements are subject to risks and uncertainties and are based on potentially inaccurate assumptions that could cause actual results to differ materially from those expected or implied by the forward-looking statements. Actual results may differ materially from the results predicted, and reported results should not be considered as an indication of future performance.
Important risks and uncertainties that could cause our actual results and financial condition to differ materially from those indicated in the forward-looking statements include, among others, the following: (i) changes in laws and regulations applicable to our business model; (ii) changes in market or industry conditions, regulatory environment, and receptivity to our technology and services; (iii) results of litigation or a security incident; (iv) the loss of one or more key clients or partners; (v) macroeconomic challenges (including high inflationary and/or high interest rate environments, tariffs, or market volatility and measures taken in response thereto) and natural disasters or new public health crises; and (vi) changes to our abilities to recruit and retain qualified team members.
For a detailed discussion of the risk factors that could affect our actual results, please refer to the risk factors identified in our SEC reports, including, but not limited to the Quarterly Report on Form 10-Q for the fiscal quarter ended June��30, 2025, expected to be filed with the SEC on or about August��8, 2025, and the Annual Report on Form 10-K for the year ended December��31, 2024, filed with the SEC on February 26, 2025. All information provided in this release and in the attachments is as of the date hereof, and we undertake no duty to update or revise this information unless required by law.
| Condensed Consolidated Balance Sheets (in thousands, except share and per share data, unaudited) | |||||||
| �� | As of June 30, | �� | As of December 31, | ||||
| �� | �� | 2025 | �� | �� | �� | 2024 | �� |
| �� | (unaudited) | �� | �� | ||||
| Assets | �� | �� | �� | ||||
| Current assets: | �� | �� | �� | ||||
| Cash and cash equivalents | $ | 50,712 | �� | �� | $ | 249,645 | �� |
| Short-term investments | �� | 46,626 | �� | �� | �� | 142,355 | �� |
| Accounts receivable, net | �� | 68,378 | �� | �� | �� | 57,182 | �� |
| Prepaid expenses and other assets | �� | 14,860 | �� | �� | �� | 16,468 | �� |
| Total current assets | �� | 180,576 | �� | �� | �� | 465,650 | �� |
| Property and equipment, net | �� | 33,399 | �� | �� | �� | 29,394 | �� |
| Intangible assets, net | �� | 98,346 | �� | �� | �� | 86,052 | �� |
| Operating lease right-of-use assets | �� | 12,345 | �� | �� | �� | 12,058 | �� |
| Goodwill | �� | 286,095 | �� | �� | �� | 259,759 | �� |
| Other assets | �� | 5,419 | �� | �� | �� | 6,016 | �� |
| Total assets | $ | 616,180 | �� | �� | $ | 858,929 | �� |
| Liabilities and stockholders�� equity | �� | �� | �� | ||||
| Current liabilities: | �� | �� | �� | ||||
| Accounts payable | $ | 8,940 | �� | �� | $ | 11,433 | �� |
| Accrued liabilities | �� | 17,367 | �� | �� | �� | 26,340 | �� |
| Deferred revenue | �� | 67,011 | �� | �� | �� | 53,281 | �� |
| Operating lease liabilities | �� | 3,878 | �� | �� | �� | 3,614 | �� |
| Current portion of long-term debt | �� | 1,627 | �� | �� | �� | 231,182 | �� |
| Total current liabilities | �� | 98,823 | �� | �� | �� | 325,850 | �� |
| Long-term debt, net of current portion | �� | 151,401 | �� | �� | �� | 151,178 | �� |
| Deferred revenue, net of current portion | �� | 329 | �� | �� | �� | 249 | �� |
| Operating lease liabilities, net of current portion | �� | 15,883 | �� | �� | �� | 16,291 | �� |
| Contingent consideration liabilities, net of current portion | �� | 2,145 | �� | �� | �� | �� | �� |
| Other liabilities | �� | 52 | �� | �� | �� | 154 | �� |
| Total liabilities | �� | 268,633 | �� | �� | �� | 493,722 | �� |
| �� | �� | �� | �� | ||||
| Stockholders�� equity: | �� | �� | �� | ||||
| Preferred stock, | �� | �� | �� | �� | �� | �� | �� |
| Common stock, | �� | 1,596,707 | �� | �� | �� | 1,552,714 | �� |
| Accumulated deficit | �� | (1,251,392 | ) | �� | �� | (1,186,672 | ) |
| Accumulated other comprehensive income (loss) | �� | 2,232 | �� | �� | �� | (835 | ) |
| Total stockholders�� equity | �� | 347,547 | �� | �� | �� | 365,207 | �� |
| Total liabilities and stockholders�� equity | $ | 616,180 | �� | �� | $ | 858,929 | �� |
| Condensed Consolidated Statements of Operations (in thousands, except per share data, unaudited) | |||||||||||||||
| �� | Three Months Ended June 30, | �� | Six Months Ended June 30, | ||||||||||||
| �� | �� | 2025 | �� | �� | �� | 2024 | �� | �� | �� | 2025 | �� | �� | �� | 2024 | �� |
| Revenue: | �� | �� | �� | �� | �� | �� | �� | ||||||||
| Technology | $ | 52,876 | �� | �� | $ | 47,635 | �� | �� | $ | 104,358 | �� | �� | $ | 94,601 | �� |
| Professional services | �� | 27,845 | �� | �� | �� | 28,267 | �� | �� | �� | 55,776 | �� | �� | �� | 56,024 | �� |
| Total revenue | �� | 80,721 | �� | �� | �� | 75,902 | �� | �� | �� | 160,134 | �� | �� | �� | 150,625 | �� |
| Cost of revenue, excluding depreciation and amortization: | �� | �� | �� | �� | �� | �� | �� | ||||||||
| Technology(1)(2)(3) | �� | 18,352 | �� | �� | �� | 16,067 | �� | �� | �� | 35,917 | �� | �� | �� | 31,382 | �� |
| Professional services(1)(2)(3) | �� | 24,128 | �� | �� | �� | 23,993 | �� | �� | �� | 49,741 | �� | �� | �� | 47,195 | �� |
| Total cost of revenue, excluding depreciation and amortization | �� | 42,480 | �� | �� | �� | 40,060 | �� | �� | �� | 85,658 | �� | �� | �� | 78,577 | �� |
| Operating expenses: | �� | �� | �� | �� | �� | �� | �� | ||||||||
| Sales and marketing(1)(2)(3) | �� | 13,206 | �� | �� | �� | 12,745 | �� | �� | �� | 27,944 | �� | �� | �� | 31,803 | �� |
| Research and development(1)(2)(3) | �� | 12,392 | �� | �� | �� | 13,884 | �� | �� | �� | 27,578 | �� | �� | �� | 28,755 | �� |
| General and administrative(1)(2)(3)(4) | �� | 8,284 | �� | �� | �� | 14,363 | �� | �� | �� | 22,446 | �� | �� | �� | 28,927 | �� |
| Depreciation and amortization | �� | 12,684 | �� | �� | �� | 10,657 | �� | �� | �� | 25,004 | �� | �� | �� | 21,182 | �� |
| Goodwill impairment | �� | 28,769 | �� | �� | �� | �� | �� | �� | �� | 28,769 | �� | �� | �� | �� | �� |
| Total operating expenses | �� | 75,335 | �� | �� | �� | 51,649 | �� | �� | �� | 131,741 | �� | �� | �� | 110,667 | �� |
| Loss from operations | �� | (37,094 | ) | �� | �� | (15,807 | ) | �� | �� | (57,265 | ) | �� | �� | (38,619 | ) |
| Interest and other (expense) income, net | �� | (3,803 | ) | �� | �� | 2,361 | �� | �� | �� | (7,159 | ) | �� | �� | 4,699 | �� |
| Loss before income taxes | �� | (40,897 | ) | �� | �� | (13,446 | ) | �� | �� | (64,424 | ) | �� | �� | (33,920 | ) |
| Income tax provision | �� | 81 | �� | �� | �� | 70 | �� | �� | �� | 296 | �� | �� | �� | 183 | �� |
| Net loss | $ | (40,978 | ) | �� | $ | (13,516 | ) | �� | $ | (64,720 | ) | �� | $ | (34,103 | ) |
| Net loss per share, basic and diluted | $ | (0.59 | ) | �� | $ | (0.23 | ) | �� | $ | (0.94 | ) | �� | $ | (0.58 | ) |
| Weighted-average shares outstanding used in calculating net loss per share, basic and diluted | �� | 69,626 | �� | �� | �� | 59,304 | �� | �� | �� | 69,092 | �� | �� | �� | 58,948 | �� |
_______________
(1) Includes stock-based compensation expense as follows:
| �� | Three Months Ended June 30, | �� | Six Months Ended June 30, | ||||||||
| �� | 2025 | �� | 2024 | �� | 2025 | �� | 2024 | ||||
| Stock-Based Compensation Expense: | (in thousands) | �� | (in thousands) | ||||||||
| Cost of revenue, excluding depreciation and amortization: | �� | �� | �� | �� | �� | �� | �� | ||||
| Technology | $ | 295 | �� | $ | 391 | �� | $ | 514 | �� | $ | 756 |
| Professional services | �� | 1,194 | �� | �� | 1,349 | �� | �� | 2,196 | �� | �� | 2,681 |
| Sales and marketing | �� | 2,542 | �� | �� | 2,452 | �� | �� | 4,704 | �� | �� | 6,442 |
| Research and development | �� | 1,316 | �� | �� | 1,676 | �� | �� | 2,449 | �� | �� | 3,520 |
| General and administrative | �� | 2,976 | �� | �� | 3,098 | �� | �� | 6,003 | �� | �� | 6,405 |
| Total | $ | 8,323 | �� | $ | 8,966 | �� | $ | 15,866 | �� | $ | 19,804 |
(2) Includes acquisition-related costs, net, as follows:
| �� | Three Months Ended June 30, | �� | Six Months Ended June 30, | ||||||||||
| �� | �� | 2025 | �� | �� | 2024 | �� | �� | 2025 | �� | �� | 2024 | ||
| Acquisition-related costs, net: | (in thousands) | �� | (in thousands) | ||||||||||
| Cost of revenue, excluding depreciation and amortization: | �� | �� | �� | �� | �� | �� | �� | ||||||
| Technology | $ | 33 | �� | �� | $ | 104 | �� | $ | 107 | �� | �� | $ | 169 |
| Professional services | �� | 56 | �� | �� | �� | 117 | �� | �� | 176 | �� | �� | �� | 208 |
| Sales and marketing | �� | (57 | ) | �� | �� | 523 | �� | �� | 441 | �� | �� | �� | 587 |
| Research and development | �� | 190 | �� | �� | �� | 228 | �� | �� | 357 | �� | �� | �� | 430 |
| General and administrative | �� | (3,942 | ) | �� | �� | 2,459 | �� | �� | (1,772 | ) | �� | �� | 2,850 |
| Total | $ | (3,720 | ) | �� | $ | 3,431 | �� | $ | (691 | ) | �� | $ | 4,244 |
(3) Includes restructuring costs as follows:
| �� | Three Months Ended June 30, | �� | Six Months Ended June 30, | ||||||||
| �� | 2025 | �� | 2024 | �� | 2025 | �� | 2024 | ||||
| Restructuring costs: | (in thousands) | �� | (in thousands) | ||||||||
| Cost of revenue, excluding depreciation and amortization: | �� | �� | �� | �� | �� | �� | �� | ||||
| Technology | $ | �� | �� | $ | �� | �� | $ | 401 | �� | $ | 79 |
| Professional services | �� | 145 | �� | �� | �� | �� | �� | 1,142 | �� | �� | 181 |
| Sales and marketing | �� | �� | �� | �� | �� | �� | �� | 352 | �� | �� | 449 |
| Research and development | �� | 237 | �� | �� | �� | �� | �� | 1,909 | �� | �� | 443 |
| General and administrative | �� | �� | �� | �� | 275 | �� | �� | 136 | �� | �� | 936 |
| Total | $ | 382 | �� | $ | 275 | �� | $ | 3,940 | �� | $ | 2,088 |
(4) Includes non-recurring lease-related charges as follows:
| �� | Three Months Ended June 30, | �� | Six Months Ended June 30, | ||||||||
| �� | 2025 | �� | 2024 | �� | 2025 | �� | 2024 | ||||
| Non-recurring lease-related charges: | (in thousands) | �� | (in thousands) | ||||||||
| General and administrative | $ | �� | �� | $ | �� | �� | $ | �� | �� | $ | 2,200 |
| Total | $ | �� | �� | $ | �� | �� | $ | �� | �� | $ | 2,200 |
��
��
| Condensed Consolidated Statements of Cash Flows (in thousands, unaudited) | |||||||
| �� | Six Months Ended June 30, | ||||||
| �� | �� | 2025 | �� | �� | �� | 2024 | �� |
| Cash flows from operating activities | �� | �� | �� | ||||
| Net loss | $ | (64,720 | ) | �� | $ | (34,103 | ) |
| Adjustments to reconcile net loss to net cash provided by operating activities: | �� | �� | �� | ||||
| Stock-based compensation expense | �� | 15,866 | �� | �� | �� | 19,804 | �� |
| Depreciation and amortization | �� | 25,004 | �� | �� | �� | 21,182 | �� |
| Impairment of long-lived assets | �� | �� | �� | �� | �� | 2,200 | �� |
| Non-cash operating lease expense | �� | 1,484 | �� | �� | �� | 1,434 | �� |
| Amortization of debt discount, issuance costs, and deferred financing costs | �� | 2,089 | �� | �� | �� | 759 | �� |
| Investment discount and premium accretion | �� | (933 | ) | �� | �� | (3,148 | ) |
| Provision for expected credit losses | �� | 1,110 | �� | �� | �� | 3,438 | �� |
| Deferred tax provision | �� | (157 | ) | �� | �� | 16 | �� |
| Change in fair value of contingent consideration liabilities | �� | (5,168 | ) | �� | �� | �� | �� |
| Goodwill impairment | �� | 28,769 | �� | �� | �� | �� | �� |
| Other | �� | (784 | ) | �� | �� | 12 | �� |
| Change in operating assets and liabilities: | �� | �� | �� | ||||
| Accounts receivable, net | �� | (10,633 | ) | �� | �� | 2,047 | �� |
| Prepaid expenses and other assets | �� | 2,468 | �� | �� | �� | 1,922 | �� |
| Accounts payable, accrued liabilities, and other liabilities | �� | (12,638 | ) | �� | �� | (2,380 | ) |
| Deferred revenue | �� | 11,423 | �� | �� | �� | 501 | �� |
| Operating lease liabilities | �� | (1,897 | ) | �� | �� | (1,806 | ) |
| Net cash (used in) provided by operating activities | �� | (8,717 | ) | �� | �� | 11,878 | �� |
| �� | �� | �� | �� | ||||
| Cash flows from investing activities | �� | �� | �� | ||||
| Proceeds from the sale and maturity of short-term investments | �� | 143,208 | �� | �� | �� | 158,200 | �� |
| Purchase of short-term investments | �� | (46,760 | ) | �� | �� | (50,197 | ) |
| Acquisition of businesses, net of cash acquired | �� | (41,114 | ) | �� | �� | (18,659 | ) |
| Capitalization of internal-use software | �� | (10,086 | ) | �� | �� | (6,287 | ) |
| Purchase of intangible assets | �� | (296 | ) | �� | �� | (365 | ) |
| Purchases of property and equipment | �� | (440 | ) | �� | �� | (498 | ) |
| Proceeds from the sale of property and equipment | �� | 25 | �� | �� | �� | 7 | �� |
| Net cash provided by investing activities | �� | 44,537 | �� | �� | �� | 82,201 | �� |
| �� | �� | �� | �� | ||||
| Cash flows from financing activities | �� | �� | �� | ||||
| Proceeds from employee stock purchase plan | �� | 1,003 | �� | �� | �� | 1,431 | �� |
| Proceeds from exercise of stock options | �� | �� | �� | �� | �� | 130 | �� |
| Repurchase of common stock | �� | (5,000 | ) | �� | �� | �� | �� |
| Repayment of debt | �� | (230,814 | ) | �� | �� | �� | �� |
| Net cash (used in) provided by financing activities | �� | (234,811 | ) | �� | �� | 1,561 | �� |
| Effect of exchange rate changes on cash and cash equivalents | �� | 58 | �� | �� | �� | (21 | ) |
| Net (decrease) increase in cash and cash equivalents | �� | (198,933 | ) | �� | �� | 95,619 | �� |
| �� | �� | �� | �� | ||||
| Cash and cash equivalents at beginning of period | �� | 249,645 | �� | �� | �� | 106,276 | �� |
| Cash and cash equivalents at end of period | $ | 50,712 | �� | �� | $ | 201,895 | �� |
��
Non-GAAP Financial Measures
To supplement our financial information presented in accordance with GAAP, we believe certain non-GAAP financial measures, including Adjusted Gross Profit, Adjusted Gross Margin, Adjusted EBITDA, Adjusted Net Income, and Adjusted Net Income per share, basic and diluted, are useful in evaluating our operating performance. For example, we exclude stock-based compensation expense because it is non-cash in nature and excluding this expense provides meaningful supplemental information regarding our operational performance and allows investors the ability to make more meaningful comparisons between our operating results and those of other companies. We use this non-GAAP financial information to evaluate our ongoing operations, as a component in determining employee bonus compensation, and for internal planning and forecasting purposes.
We believe that non-GAAP financial information, when taken collectively, may be helpful to investors because it provides consistency and comparability with past financial performance. However, non-GAAP financial information is presented for supplemental informational purposes only, has limitations as an analytical tool and should not be considered in isolation or as a substitute for financial information presented in accordance with GAAP. In addition, other companies, including companies in our industry, may calculate similarly-titled non-GAAP financial measures differently or may use other measures to evaluate their performance, all of which could reduce the usefulness of our non-GAAP financial measures as tools for comparison. A reconciliation is provided below for each non-GAAP financial measure to the most directly comparable financial measure stated in accordance with GAAP. Investors are encouraged to review the related GAAP financial measures and the reconciliation of these non-GAAP financial measures to their most directly comparable GAAP financial measures, and not to rely on any single financial measure to evaluate our business.
Adjusted��Gross Profit and��Adjusted��Gross Margin
Gross profit is a GAAP financial measure that is calculated as revenue less cost of revenue, including depreciation and amortization of capitalized software development costs and acquired technology. We calculate gross margin as gross profit divided by our revenue. Adjusted��Gross Profit is a��non-GAAP��financial measure that we define as gross profit, adjusted for (i) depreciation and amortization, (ii) stock-based compensation, (iii) acquisition-related costs, net, and (iv) restructuring costs, as applicable. We define��Adjusted��Gross Margin as our��Adjusted��Gross Profit divided by our revenue. We believe��Adjusted��Gross Profit and��Adjusted��Gross Margin are useful to investors as they eliminate the impact of certain��non-cash��expenses and allow a direct comparison of these measures between periods without the impact of��non-cash��expenses and certain other non-recurring operating expenses.
We present both of these measures for our technology and professional services business. We believe these non-GAAP financial measures are useful in evaluating our operating performance compared to that of other companies in our industry, as these metrics generally eliminate the effects of certain items that may vary from company to company for reasons unrelated to overall profitability.
The following is a calculation of our gross profit and gross margin and a reconciliation of gross profit and gross margin, the most directly comparable financial measures calculated in accordance with GAAP, to our Adjusted Gross Profit and Adjusted Gross Margin in total and for technology and professional services for the three months ended June 30, 2025 and 2024.
| �� | Three Months Ended June 30, 2025 | ||||||||||
| �� | (in thousands, except percentages) | ||||||||||
| �� | Technology | �� | Professional Services | �� | Total | ||||||
| Revenue | $ | 52,876 | �� | �� | $ | 27,845 | �� | �� | $ | 80,721 | �� |
| Cost of revenue, excluding depreciation and amortization | �� | (18,352 | ) | �� | �� | (24,128 | ) | �� | �� | (42,480 | ) |
| Amortization of intangible assets, cost of revenue | �� | (4,857 | ) | �� | �� | �� | �� | �� | �� | (4,857 | ) |
| Depreciation of property and equipment, cost of revenue | �� | (3,051 | ) | �� | �� | �� | �� | �� | �� | (3,051 | ) |
| Gross profit | �� | 26,616 | �� | �� | �� | 3,717 | �� | �� | �� | 30,333 | �� |
| Gross margin | �� | 50 | % | �� | �� | 13 | % | �� | �� | 38 | % |
| Add: | �� | �� | �� | �� | �� | ||||||
| Amortization of intangible assets, cost of revenue | �� | 4,857 | �� | �� | �� | �� | �� | �� | �� | 4,857 | �� |
| Depreciation of property and equipment, cost of revenue | �� | 3,051 | �� | �� | �� | �� | �� | �� | �� | 3,051 | �� |
| Stock-based compensation | �� | 295 | �� | �� | �� | 1,194 | �� | �� | �� | 1,489 | �� |
| Acquisition-related costs, net(1) | �� | 33 | �� | �� | �� | 56 | �� | �� | �� | 89 | �� |
| Restructuring costs(2) | �� | �� | �� | �� | �� | 145 | �� | �� | �� | 145 | �� |
| Adjusted Gross Profit | $ | 34,852 | �� | �� | $ | 5,112 | �� | �� | $ | 39,964 | �� |
| Adjusted Gross Margin | �� | 66 | % | �� | �� | 18 | % | �� | �� | 50 | % |
___________________
(1)������Acquisition-related costs, net include deferred retention expenses attributable to the Upfront, Intraprise, ARMUS, and KPI Ninja acquisitions.
(2)������Restructuring costs include severance and other team member costs from workforce reductions. For additional details, refer to Note 19 in our condensed consolidated financial statements.
| �� | Three Months Ended June 30, 2024 | ||||||||||
| �� | (in thousands, except percentages) | ||||||||||
| �� | Technology | �� | Professional Services | �� | Total | ||||||
| Revenue | $ | 47,635 | �� | �� | $ | 28,267 | �� | �� | $ | 75,902 | �� |
| Cost of revenue, excluding depreciation and amortization | �� | (16,067 | ) | �� | �� | (23,993 | ) | �� | �� | (40,060 | ) |
| Amortization of intangible assets, cost of revenue | �� | (4,583 | ) | �� | �� | �� | �� | �� | �� | (4,583 | ) |
| Depreciation of property and equipment, cost of revenue | �� | (2,453 | ) | �� | �� | �� | �� | �� | �� | (2,453 | ) |
| Gross profit | �� | 24,532 | �� | �� | �� | 4,274 | �� | �� | �� | 28,806 | �� |
| Gross margin | �� | 51 | % | �� | �� | 15 | % | �� | �� | 38 | % |
| Add: | �� | �� | �� | �� | �� | ||||||
| Amortization of intangible assets, cost of revenue | �� | 4,583 | �� | �� | �� | �� | �� | �� | �� | 4,583 | �� |
| Depreciation of property and equipment, cost of revenue | �� | 2,453 | �� | �� | �� | �� | �� | �� | �� | 2,453 | �� |
| Stock-based compensation | �� | 391 | �� | �� | �� | 1,349 | �� | �� | �� | 1,740 | �� |
| Acquisition-related costs, net(1) | �� | 104 | �� | �� | �� | 117 | �� | �� | �� | 221 | �� |
| Adjusted Gross Profit | $ | 32,063 | �� | �� | $ | 5,740 | �� | �� | $ | 37,803 | �� |
| Adjusted Gross Margin | �� | 67 | % | �� | �� | 20 | % | �� | �� | 50 | % |
___________________
(1)������Acquisition-related costs, net include deferred retention expenses attributable to the Carevive, ARMUS, and KPI Ninja acquisitions.
��
Adjusted EBITDA
Adjusted EBITDA is a non-GAAP financial measure that we define as net loss adjusted for (i) interest and other (income) expense, net, (ii) income tax provision, (iii) depreciation and amortization, (iv) stock-based compensation, (v) acquisition-related costs, net, (vi) restructuring costs, (vii) goodwill impairment, and (viii) non-recurring lease-related charges. We view acquisition-related expenses when applicable, such as transaction costs and changes in the fair value of contingent consideration liabilities that are directly related to business combinations, as costs that are unpredictable, dependent upon factors outside of our control, and are not necessarily reflective of operational performance during a period. We believe that excluding restructuring costs, goodwill impairment, and non-recurring lease-related charges, as applicable, allows for more meaningful comparisons between operating results from period to period as these are separate from the core activities that arise in the ordinary course of our business and are not part of our ongoing operations. We believe Adjusted EBITDA provides investors with useful information on period-to-period performance as evaluated by management and a comparison with our past financial performance, and is useful in evaluating our operating performance compared to that of other companies in our industry, as this metric generally eliminates the effects of certain items that may vary from company to company for reasons unrelated to overall operating performance. The following is a reconciliation of our net loss, the most directly comparable financial measure calculated in accordance with GAAP, to Adjusted EBITDA for the three months ended June 30, 2025 and 2024:
| �� | Three Months Ended June 30, | ||||||
| �� | �� | 2025 | �� | �� | �� | 2024 | �� |
| �� | (in thousands) | ||||||
| Net loss | $ | (40,978 | ) | �� | $ | (13,516 | ) |
| Add: | �� | �� | �� | ||||
| Interest and other (income) expense, net | �� | 3,803 | �� | �� | �� | (2,361 | ) |
| Income tax provision | �� | 81 | �� | �� | �� | 70 | �� |
| Depreciation and amortization | �� | 12,684 | �� | �� | �� | 10,657 | �� |
| Stock-based compensation | �� | 8,323 | �� | �� | �� | 8,966 | �� |
| Acquisition-related costs, net(1) | �� | (3,720 | ) | �� | �� | 3,431 | �� |
| Restructuring costs(2) | �� | 382 | �� | �� | �� | 275 | �� |
| Goodwill impairment(3) | �� | 28,769 | �� | �� | �� | �� | �� |
| Adjusted EBITDA | $ | 9,344 | �� | �� | $ | 7,522 | �� |
__________________
(1)������Acquisition-related costs, net include third-party fees associated with due diligence, deferred retention expenses, post-acquisition restructuring costs incurred as part of business combinations, and changes in fair value of contingent consideration liabilities for potential earn-out payments.
(2)������Restructuring costs include severance and other team member costs from workforce reductions. For additional details, refer to Note 19 in our condensed consolidated financial statements.
(3)������Goodwill impairment was recognized as a result of impairment indicators and a quantitative test indicating the fair values of the Technology and the Professional Services reporting units were below their respective carrying values as of June 30, 2025. For additional details, refer to Note 4 in our condensed consolidated financial statements.
Adjusted Net Income and Adjusted Net Income Per Share
Adjusted Net Income is a non-GAAP financial measure that we define as net loss adjusted for (i) stock-based compensation, (ii) amortization of acquired intangibles, (iii) restructuring costs, (iv) acquisition-related costs, net, including the change in fair value of contingent consideration liabilities, (v) goodwill impairment, and (vi) non-cash interest expense related to debt facilities. We believe Adjusted Net Income provides investors with useful information on period-to-period performance as evaluated by management and comparison with our past financial performance and is useful in evaluating our operating performance compared to that of other companies in our industry, as this metric generally eliminates the effects of certain items that may vary from company to company for reasons unrelated to overall operating performance. The following is a reconciliation of our net loss, the most directly comparable financial measure calculated in accordance with GAAP, to Adjusted Net Income, for the three months ended June 30, 2025 and 2024:
| �� | Three Months Ended June 30, | ||||||
| �� | 2025 | �� | 2024 | ||||
| Numerator: | (in thousands, except share and per share amounts) | ||||||
| Net loss | $ | (40,978 | ) | �� | $ | (13,516 | ) |
| Add: | �� | �� | �� | ||||
| Stock-based compensation | �� | 8,323 | �� | �� | �� | 8,966 | �� |
| Amortization of acquired intangibles | �� | 9,047 | �� | �� | �� | 7,535 | �� |
| Restructuring costs(1) | �� | 382 | �� | �� | �� | 275 | �� |
| Acquisition-related costs, net(2) | �� | (3,720 | ) | �� | �� | 3,431 | �� |
| Goodwill impairment(3) | �� | 28,769 | �� | �� | �� | �� | �� |
| Non-cash interest expense related to debt facilities | �� | 881 | �� | �� | �� | 380 | �� |
| Adjusted Net Income | $ | 2,704 | �� | �� | $ | 7,071 | �� |
| Denominator: | �� | �� | �� | ||||
| Weighted-average shares outstanding used in calculating net loss per share, basic and diluted, and Adjusted Net Income per share, basic | �� | 69,625,540 | �� | �� | �� | 59,303,791 | �� |
| Non-GAAP dilutive effect of stock-based awards | �� | 164,532 | �� | �� | �� | 165,226 | �� |
| Non-GAAP weighted-average shares outstanding used in calculating Adjusted Net Income per share, diluted | �� | 69,790,072 | �� | �� | �� | 59,469,017 | �� |
| �� | �� | �� | �� | ||||
| Net loss per share, basic and diluted | $ | (0.59 | ) | �� | $ | (0.23 | ) |
| Adjusted Net Income per share, basic and diluted | $ | 0.04 | �� | �� | $ | 0.12 | �� |
______________
(1)������Restructuring costs include severance and other team member costs from workforce reductions. For additional details, refer to Note 19 in our condensed consolidated financial statements.
(2)������Acquisition-related costs, net includes third-party fees associated with due diligence, deferred retention expenses, post-acquisition restructuring costs incurred as part of business combinations, and changes in fair value of contingent consideration liabilities for potential earn-out payments.
(3)������Goodwill impairment was recognized as a result of impairment indicators and a quantitative test indicating the fair values of the Technology and the Professional Services reporting units were below their respective carrying values as of June 30, 2025. For additional details, refer to Note 4 in our condensed consolidated financial statements.
��
Health Catalyst Investor Relations Contact:
Jack Knight
Vice President, Investor Relations
+1 (855)-309-6800
��
Health Catalyst Media Contact:
Kathryn Mykleseth
Director, Public Relations and Communications
��
To view this slide as a PDF, please click here:��