Health Catalyst Reports First Quarter 2025 Results
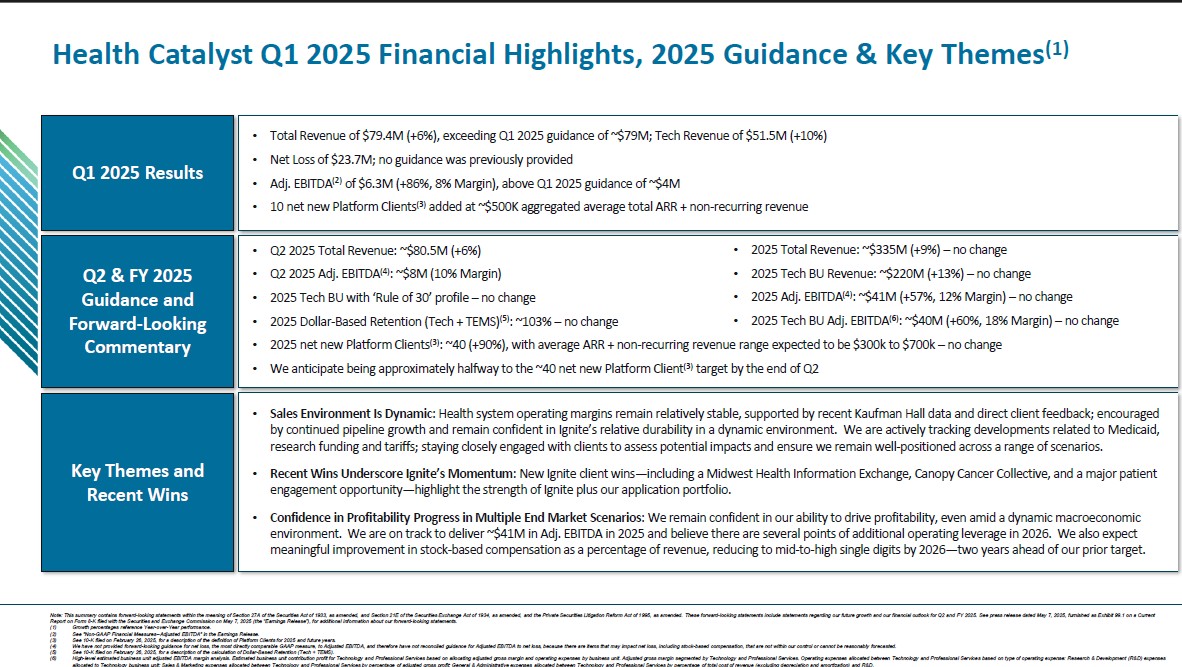
Health Catalyst (NASDAQ: HCAT) reported its Q1 2025 financial results with total revenue of $79.4 million, representing a 6% year-over-year growth, and Adjusted EBITDA of $6.3 million, marking an 86% increase from the previous year. The company successfully added 10 net new Platform Clients in Q1 2025, positioning them well to achieve their target of 40 net new Platform Client additions for the year.
The company's financial metrics showed mixed results, with gross margin declining to 36% from 39% year-over-year, and net loss increasing to $23.7 million. For Q2 2025, Health Catalyst expects revenue of approximately $80.5 million and Adjusted EBITDA of $8 million. The full-year 2025 guidance projects total revenue of $335 million, including technology revenue of $220 million, and Adjusted EBITDA of $41 million.
Health Catalyst (NASDAQ: HCAT) ha comunicato i risultati finanziari del primo trimestre 2025, con un fatturato totale di 79,4 milioni di dollari, segnando una crescita del 6% rispetto all'anno precedente, e un EBITDA rettificato di 6,3 milioni di dollari, con un aumento dell'86% rispetto all'anno precedente. L'azienda ha acquisito con successo 10 nuovi clienti netti per la piattaforma nel primo trimestre 2025, posizionandosi bene per raggiungere l'obiettivo di 40 nuovi clienti netti per la piattaforma entro l'anno.
I parametri finanziari dell'azienda hanno mostrato risultati contrastanti, con un margine lordo in calo al 36% rispetto al 39% dell'anno precedente, e una perdita netta aumentata a 23,7 milioni di dollari. Per il secondo trimestre 2025, Health Catalyst prevede un fatturato di circa 80,5 milioni di dollari e un EBITDA rettificato di 8 milioni di dollari. Le previsioni per l'intero 2025 indicano un fatturato totale di 335 milioni di dollari, di cui 220 milioni derivanti dalla tecnologia, e un EBITDA rettificato di 41 milioni di dollari.
Health Catalyst (NASDAQ: HCAT) informó sus resultados financieros del primer trimestre de 2025 con un ingreso total de 79.4 millones de dólares, representando un crecimiento interanual del 6%, y un EBITDA ajustado de 6.3 millones de dólares, lo que marca un aumento del 86% respecto al año anterior. La compañía añadió con éxito 10 nuevos clientes netos para la plataforma en el primer trimestre de 2025, posicionándose bien para alcanzar su objetivo de 40 nuevas incorporaciones netas de clientes para la plataforma durante el año.
Los indicadores financieros de la empresa mostraron resultados mixtos, con un margen bruto que disminuyó al 36% desde el 39% interanual, y una pérdida neta que aumentó a 23.7 millones de dólares. Para el segundo trimestre de 2025, Health Catalyst espera ingresos de aproximadamente 80.5 millones de dólares y un EBITDA ajustado de 8 millones de dólares. La guía para todo el año 2025 proyecta ingresos totales de 335 millones de dólares, incluyendo ingresos tecnológicos de 220 millones, y un EBITDA ajustado de 41 millones de dólares.
Health Catalyst (NASDAQ: HCAT)�� 2025�� 1분기 재무 실적�� 발표하며, �� 매출 7,940�� 달러�� 전년 대�� 6% 성장했고, 조정 EBITDA 630�� 달러�� 전년 대�� 86% 증가했습니다. 회사�� 2025�� 1분기�� �� 신규 플랫�� 고객 10���� 성공적으�� 확보하여, 연간 �� 신규 플랫�� 고객 40�� 추가 목표 달성�� 좋은 위치�� 차지했습니다.
회사�� 재무 지표는 혼재�� 결과�� 보였으며, 총이익률은 전년 대�� 39%에서 36%�� 하락했고, 순손실은 2,370�� 달러�� 증가했습니다. 2025�� 2분기에는 매출 �� 8,050�� 달러, 조정 EBITDA 800�� 달러�� 예상합니��. 2025�� 전체 가이던스는 �� 매출 3�� 3,500�� 달러, �� �� 기술 매출 2�� 2,000�� 달러, 조정 EBITDA 4,100�� 달러�� 전망합니��.
Health Catalyst (NASDAQ : HCAT) a publié ses résultats financiers du premier trimestre 2025 avec un chiffre d'affaires total de 79,4 millions de dollars, représentant une croissance de 6 % d'une année sur l'autre, et un EBITDA ajusté de 6,3 millions de dollars, soit une augmentation de 86 % par rapport à l'année précédente. L'entreprise a ajouté avec succès 10 nouveaux clients nets pour la plateforme au premier trimestre 2025, ce qui la positionne favorablement pour atteindre son objectif de 40 nouveaux clients nets pour la plateforme sur l'année.
Les indicateurs financiers de la société ont montré des résultats mitigés, avec une marge brute en baisse à 36 % contre 39 % l'année précédente, et une perte nette en hausse à 23,7 millions de dollars. Pour le deuxième trimestre 2025, Health Catalyst prévoit un chiffre d'affaires d'environ 80,5 millions de dollars et un EBITDA ajusté de 8 millions de dollars. Les prévisions pour l'ensemble de l'année 2025 projettent un chiffre d'affaires total de 335 millions de dollars, dont 220 millions provenant des revenus technologiques, et un EBITDA ajusté de 41 millions de dollars.
Health Catalyst (NASDAQ: HCAT) meldete seine Finanzergebnisse für das erste Quartal 2025 mit einem Gesamtumsatz von 79,4 Millionen US-Dollar, was einem Wachstum von 6 % im Jahresvergleich entspricht, und einem bereinigten EBITDA von 6,3 Millionen US-Dollar, was einer Steigerung von 86 % gegenüber dem Vorjahr entspricht. Das Unternehmen konnte im ersten Quartal 2025 10 netto neue Plattformkunden gewinnen und ist damit gut positioniert, um das Ziel von 40 netto neuen Plattformkunden im Jahresverlauf zu erreichen.
Die finanziellen Kennzahlen des Unternehmens zeigten gemischte Ergebnisse, mit einer Bruttomarge, die von 39 % auf 36 % sank, und einem gestiegenen Nettoverlust von 23,7 Millionen US-Dollar. Für das zweite Quartal 2025 erwartet Health Catalyst einen Umsatz von etwa 80,5 Millionen US-Dollar und ein bereinigtes EBITDA von 8 Millionen US-Dollar. Die Prognose für das Gesamtjahr 2025 sieht einen Gesamtumsatz von 335 Millionen US-Dollar vor, davon 220 Millionen US-Dollar aus dem Technologiebereich, sowie ein bereinigtes EBITDA von 41 Millionen US-Dollar.
- Revenue grew 6% year-over-year to $79.4 million
- Adjusted EBITDA increased 86% to $6.3 million
- Added 10 net new Platform Clients in Q1
- Strong Q2 guidance with expected revenue of $80.5 million
- Full-year guidance projects significant revenue of $335 million
- Net loss increased 15% to $23.7 million
- Gross margin declined from 39% to 36% year-over-year
- Adjusted Gross Margin decreased from 51% to 49%
Insights
Health Catalyst reported Q1 results with 6% revenue growth and 86% EBITDA improvement, despite margin compression and wider net loss.
Health Catalyst's Q1 2025 financial performance presents a mixed picture that requires careful analysis. The company reported total revenue of
The company's client acquisition metrics show promising momentum with 10 net new Platform Clients added during Q1. Management specifically highlighted this achievement as notable since Q1 typically experiences slower bookings, and this performance strengthens their confidence in reaching their target of 40 net new Platform Client additions for 2025.
However, several concerning metrics balance these positives. GAAP gross profit declined
Forward guidance suggests continued steady progress, with Q2 2025 revenue projected at approximately
SALT LAKE CITY, May 07, 2025 (GLOBE NEWSWIRE) -- Health Catalyst, Inc. (“Health Catalyst,�� Nasdaq: HCAT), a leading provider of data and analytics technology and services to healthcare organizations, today reported financial results for the quarter ended March��31, 2025.
“For the first quarter of 2025, I am pleased by our strong financial results, including total revenue of
Financial Highlights for the Three Months Ended March 31, 2025
Key Financial Metrics
| �� | Three Months Ended March 31, | �� | Year over Year Change | ||||||
| �� | �� | 2025 | �� | �� | �� | 2024 | �� | �� | |
| GAAP Financial Measures: | (in thousands, except percentages, unaudited) | ||||||||
| Total revenue | $ | 79,413 | �� | �� | $ | 74,723 | �� | �� | |
| Gross profit | $ | 28,659 | �� | �� | $ | 29,321 | �� | �� | (2)% |
| Gross margin | �� | 36 | % | �� | �� | 39 | % | �� | �� |
| Net loss | $ | (23,742 | ) | �� | $ | (20,587 | ) | �� | (15)% |
| Non-GAAP Financial Measures:(1) | �� | �� | �� | �� | �� | ||||
| Adjusted Gross Profit | $ | 39,048 | �� | �� | $ | 38,319 | �� | �� | |
| Adjusted Gross Margin | �� | 49 | % | �� | �� | 51 | % | �� | �� |
| Adjusted EBITDA | $ | 6,279 | �� | �� | $ | 3,377 | �� | �� | |
________________________
(1)�� These measures are not calculated in accordance with generally accepted accounting principles in the United States (GAAP). See the accompanying "Non-GAAP Financial Measures" section below for more information about these financial measures, including the limitations of such measures, and for a reconciliation of each measure to the most directly comparable measure calculated in accordance with GAAP.
Financial Outlook
Health Catalyst provides forward-looking guidance on total revenue, a GAAP measure, and Adjusted EBITDA, a non-GAAP measure.
For the second quarter of 2025, we expect:
- Total revenue of approximately
$80.5 million , and - Adjusted EBITDA of approximately
$8 million
For the full year of 2025, we expect:
- Total revenue of approximately
$335 million , - Technology revenue of approximately
$220 million , and - Adjusted EBITDA of approximately
$41 million
We have not provided forward-looking guidance for net loss, the most directly comparable GAAP measure to Adjusted EBITDA, and therefore have not reconciled guidance for Adjusted EBITDA to net loss, because there are items that may impact net loss, including stock-based compensation, that are not within our control or cannot be reasonably forecasted.
Quarterly Conference Call Details
We will host a conference call to review the results today, Wednesday, May��7, 2025, at 5:00 p.m. E.T. The conference call can be accessed by dialing (800) 343-5172 for U.S. participants, or (203) 518-9856 for international participants, and referencing conference ID “HCATQ125.�� A live audio webcast will be available online at https://ir.healthcatalyst.com/. A replay of the call will be available via webcast for on-demand listening shortly after the completion of the call, at the same web link, and will remain available for approximately 90 days.
About Health Catalyst
Health Catalyst (Nasdaq: HCAT) is a leading provider of data and analytics technology and services that ignite smarter healthcare, lighting the path to measurable clinical, financial, and operational improvement. More than 1,000 organizations worldwide rely on Health Catalyst's offerings, including our cloud-based technology ecosystem Health Catalyst Ignite��, AI-enabled data and analytics solutions, and expert services to drive meaningful outcomes across hundreds of millions of patient records. Powered by high-value data, standardized measures and registries, and deep healthcare domain expertise, Ignite helps organizations transform complex information into actionable insights. Backed by a multi-decade mission and a proven track record of delivering billions of dollars in measurable results, Health Catalyst continues to serve as the catalyst for massive, measurable, data-informed healthcare improvement and innovation.
Available Information
Our investors and others should note that we announce material information to the public about our company, products and services, and other matters related to our company through a variety of means, including our website (https://www.healthcatalyst.com/), our investor relations website (https://ir.healthcatalyst.com/), press releases, SEC filings, public conference calls, and social media, including our and our CEO's social media accounts such as LinkedIn (https://www.linkedin.com/), in order to achieve broad, non-exclusionary distribution of information to the public and to comply with our disclosure obligations under Regulation FD.
Forward-Looking Statements
This release contains forward-looking statements within the meaning of Section 27A of the Securities Act of 1933, as amended, and Section 21E of the Securities Exchange Act of 1934, as amended, and the Private Securities Litigation Reform Act of 1995, as amended. These forward-looking statements include statements regarding our future growth and our financial outlook for the second quarter and full year 2025. Forward-looking statements are subject to risks and uncertainties and are based on potentially inaccurate assumptions that could cause actual results to differ materially from those expected or implied by the forward-looking statements. Actual results may differ materially from the results predicted, and reported results should not be considered as an indication of future performance.
Important risks and uncertainties that could cause our actual results and financial condition to differ materially from those indicated in the forward-looking statements include, among others, the following: (i) changes in laws and regulations applicable to our business model; (ii) changes in market or industry conditions, regulatory environment, and receptivity to our technology and services; (iii) results of litigation or a security incident; (iv) the loss of one or more key clients or partners; (v) macroeconomic challenges (including high inflationary and/or high interest rate environments, tariffs, or market volatility and measures taken in response thereto) and natural disasters or new public health crises; and (vi) changes to our abilities to recruit and retain qualified team members. For a detailed discussion of the risk factors that could affect our actual results, please refer to the risk factors identified in our SEC reports, including, but not limited to the Quarterly Report on Form 10-Q for the fiscal quarter ended March��31, 2025, expected to be filed with the SEC on or about May 12, 2025, and the Annual Report on Form 10-K for the year ended December��31, 2024, filed with the SEC on February 26, 2025. All information provided in this release and in the attachments is as of the date hereof, and we undertake no duty to update or revise this information unless required by law.
| Condensed Consolidated Balance Sheets (in thousands, except share and per share data, unaudited) | ||||||||
| �� | ||||||||
| �� | �� | As of March 31, | �� | As of December 31, | ||||
| �� | �� | �� | 2025 | �� | �� | �� | 2024 | �� |
| �� | �� | (unaudited) | �� | �� | ||||
| Assets | �� | �� | �� | �� | ||||
| Current assets: | �� | �� | �� | �� | ||||
| Cash and cash equivalents | �� | $ | 341,968 | �� | �� | $ | 249,645 | �� |
| Short-term investments | �� | �� | �� | �� | �� | �� | 142,355 | �� |
| Accounts receivable, net | �� | �� | 64,046 | �� | �� | �� | 57,182 | �� |
| Prepaid expenses and other assets | �� | �� | 16,702 | �� | �� | �� | 16,468 | �� |
| Total current assets | �� | �� | 422,716 | �� | �� | �� | 465,650 | �� |
| Property and equipment, net | �� | �� | 31,648 | �� | �� | �� | 29,394 | �� |
| Intangible assets, net | �� | �� | 106,400 | �� | �� | �� | 86,052 | �� |
| Operating lease right-of-use assets | �� | �� | 11,877 | �� | �� | �� | 12,058 | �� |
| Goodwill | �� | �� | 313,380 | �� | �� | �� | 259,759 | �� |
| Other assets | �� | �� | 5,521 | �� | �� | �� | 6,016 | �� |
| Total assets | �� | $ | 891,542 | �� | �� | $ | 858,929 | �� |
| Liabilities and stockholders�� equity | �� | �� | �� | �� | ||||
| Current liabilities: | �� | �� | �� | �� | ||||
| Accounts payable | �� | $ | 8,946 | �� | �� | $ | 11,433 | �� |
| Accrued liabilities | �� | �� | 23,795 | �� | �� | �� | 26,340 | �� |
| Deferred revenue | �� | �� | 71,497 | �� | �� | �� | 53,281 | �� |
| Operating lease liabilities | �� | �� | 3,760 | �� | �� | �� | 3,614 | �� |
| Current portion of long-term debt | �� | �� | 231,563 | �� | �� | �� | 231,182 | �� |
| Total current liabilities | �� | �� | 339,561 | �� | �� | �� | 325,850 | �� |
| Long-term debt, net of current portion | �� | �� | 151,291 | �� | �� | �� | 151,178 | �� |
| Deferred revenue, net of current portion | �� | �� | 407 | �� | �� | �� | 249 | �� |
| Operating lease liabilities, net of current portion | �� | �� | 15,751 | �� | �� | �� | 16,291 | �� |
| Contingent consideration liabilities, net of current portion | �� | �� | 7,313 | �� | �� | �� | �� | �� |
| Other liabilities | �� | �� | 408 | �� | �� | �� | 154 | �� |
| Total liabilities | �� | �� | 514,731 | �� | �� | �� | 493,722 | �� |
| �� | �� | �� | �� | �� | ||||
| Stockholders�� equity: | �� | �� | �� | �� | ||||
| Preferred stock, | �� | �� | �� | �� | �� | �� | �� | �� |
| Common stock, | �� | �� | 1,587,085 | �� | �� | �� | 1,552,714 | �� |
| Accumulated deficit | �� | �� | (1,210,414 | ) | �� | �� | (1,186,672 | ) |
| Accumulated other comprehensive income (loss) | �� | �� | 140 | �� | �� | �� | (835 | ) |
| Total stockholders�� equity | �� | �� | 376,811 | �� | �� | �� | 365,207 | �� |
| Total liabilities and stockholders�� equity | �� | $ | 891,542 | �� | �� | $ | 858,929 | �� |
| �� | ||||||||
| Condensed Consolidated Statements of Operations (in thousands, except per share data, unaudited) | ||||||||
| �� | ||||||||
| �� | �� | Three Months Ended March 31, | ||||||
| �� | �� | �� | 2025 | �� | �� | �� | 2024 | �� |
| Revenue: | �� | �� | �� | �� | ||||
| Technology | �� | $ | 51,482 | �� | �� | $ | 46,966 | �� |
| Professional services | �� | �� | 27,931 | �� | �� | �� | 27,757 | �� |
| Total revenue | �� | �� | 79,413 | �� | �� | �� | 74,723 | �� |
| Cost of revenue, excluding depreciation and amortization: | �� | �� | �� | �� | ||||
| Technology(1)(2)(3) | �� | �� | 17,565 | �� | �� | �� | 15,315 | �� |
| Professional services(1)(2)(3) | �� | �� | 25,613 | �� | �� | �� | 23,202 | �� |
| Total cost of revenue, excluding depreciation and amortization | �� | �� | 43,178 | �� | �� | �� | 38,517 | �� |
| Operating expenses: | �� | �� | �� | �� | ||||
| Sales and marketing(1)(2)(3) | �� | �� | 14,738 | �� | �� | �� | 19,058 | �� |
| Research and development(1)(2)(3) | �� | �� | 15,186 | �� | �� | �� | 14,871 | �� |
| General and administrative(1)(2)(3)(4) | �� | �� | 14,162 | �� | �� | �� | 14,564 | �� |
| Depreciation and amortization | �� | �� | 12,320 | �� | �� | �� | 10,525 | �� |
| Total operating expenses | �� | �� | 56,406 | �� | �� | �� | 59,018 | �� |
| Loss from operations | �� | �� | (20,171 | ) | �� | �� | (22,812 | ) |
| Interest and other (expense) income, net | �� | �� | (3,356 | ) | �� | �� | 2,338 | �� |
| Loss before income taxes | �� | �� | (23,527 | ) | �� | �� | (20,474 | ) |
| Income tax provision | �� | �� | 215 | �� | �� | �� | 113 | �� |
| Net loss | �� | $ | (23,742 | ) | �� | $ | (20,587 | ) |
| Net loss per share, basic and diluted | �� | $ | (0.35 | ) | �� | $ | (0.35 | ) |
| Weighted-average shares outstanding used in calculating net loss per share, basic and diluted | �� | �� | 68,552 | �� | �� | �� | 58,592 | �� |
_______________
(1)�� ��Includes stock-based compensation expense as follows:
| �� | �� | Three Months Ended March 31, | ||||||
| �� | �� | 2025 | �� | 2024 | ||||
| Stock-Based Compensation Expense: | �� | (in thousands) | ||||||
| Cost of revenue, excluding depreciation and amortization: | �� | �� | �� | �� | ||||
| Technology | �� | $ | 219 | �� | �� | $ | 365 | �� |
| Professional services | �� | �� | 1,002 | �� | �� | �� | 1,332 | �� |
| Sales and marketing | �� | �� | 2,162 | �� | �� | �� | 3,990 | �� |
| Research and development | �� | �� | 1,133 | �� | �� | �� | 1,844 | �� |
| General and administrative | �� | �� | 3,027 | �� | �� | �� | 3,307 | �� |
| Total | �� | $ | 7,543 | �� | �� | $ | 10,838 | �� |
(2)���� Includes acquisition-related costs, net, as follows:
| �� | �� | Three Months Ended March 31, | ||||||
| �� | �� | �� | 2025 | �� | �� | �� | 2024 | �� |
| Acquisition-related costs, net: | �� | (in thousands) | ||||||
| Cost of revenue, excluding depreciation and amortization: | �� | �� | �� | �� | ||||
| Technology | �� | $ | 74 | �� | �� | $ | 65 | �� |
| Professional services | �� | �� | 120 | �� | �� | �� | 91 | �� |
| Sales and marketing | �� | �� | 498 | �� | �� | �� | 64 | �� |
| Research and development | �� | �� | 167 | �� | �� | �� | 202 | �� |
| General and administrative | �� | �� | 2,170 | �� | �� | �� | 391 | �� |
| Total | �� | $ | 3,029 | �� | �� | $ | 813 | �� |
(3)���� Includes restructuring costs as follows:
| �� | �� | Three Months Ended March 31, | ||||||
| �� | �� | �� | 2025 | �� | �� | �� | 2024 | �� |
| Restructuring costs: | �� | (in thousands) | ||||||
| Cost of revenue, excluding depreciation and amortization: | �� | �� | �� | �� | ||||
| Technology | �� | $ | 401 | �� | �� | $ | 79 | �� |
| Professional services | �� | �� | 997 | �� | �� | �� | 181 | �� |
| Sales and marketing | �� | �� | 352 | �� | �� | �� | 449 | �� |
| Research and development | �� | �� | 1,672 | �� | �� | �� | 443 | �� |
| General and administrative | �� | �� | 136 | �� | �� | �� | 661 | �� |
| Total | �� | $ | 3,558 | �� | �� | $ | 1,813 | �� |
(4)���� Includes non-recurring lease-related charges as follows:
| �� | �� | Three Months Ended March 31, | ||||||
| �� | �� | �� | 2025 | �� | �� | �� | 2024 | �� |
| Non-recurring lease-related charges: | �� | (in thousands) | ||||||
| General and administrative | �� | $ | �� | �� | �� | $ | 2,200 | �� |
| Total | �� | $ | �� | �� | �� | $ | 2,200 | �� |
| �� | ||||||||
| Condensed Consolidated Statements of Cash Flows (in thousands, unaudited) | ||||||||
| �� | ||||||||
| �� | �� | Three Months Ended March 31, | ||||||
| �� | �� | �� | 2025 | �� | �� | �� | 2024 | �� |
| Cash flows from operating activities | �� | �� | �� | �� | ||||
| Net loss | �� | $ | (23,742 | ) | �� | $ | (20,587 | ) |
| Adjustments to reconcile net loss to net cash provided by operating activities: | �� | �� | �� | �� | ||||
| Stock-based compensation expense | �� | �� | 7,543 | �� | �� | �� | 10,838 | �� |
| Depreciation and amortization | �� | �� | 12,320 | �� | �� | �� | 10,525 | �� |
| Impairment of long-lived assets | �� | �� | �� | �� | �� | �� | 2,200 | �� |
| Non-cash operating lease expense | �� | �� | 735 | �� | �� | �� | 781 | �� |
| Amortization of debt discount, issuance costs, and deferred financing costs | �� | �� | 1,208 | �� | �� | �� | 379 | �� |
| Investment discount and premium accretion | �� | �� | (914 | ) | �� | �� | (1,965 | ) |
| Provision for expected credit losses | �� | �� | 810 | �� | �� | �� | 2,405 | �� |
| Deferred tax provision | �� | �� | 67 | �� | �� | �� | 14 | �� |
| Other | �� | �� | (292 | ) | �� | �� | 4 | �� |
| Change in operating assets and liabilities: | �� | �� | �� | �� | ||||
| Accounts receivable, net | �� | �� | (6,067 | ) | �� | �� | 4,011 | �� |
| Prepaid expenses and other assets | �� | �� | 764 | �� | �� | �� | 300 | �� |
| Accounts payable, accrued liabilities, and other liabilities | �� | �� | (7,196 | ) | �� | �� | (5,495 | ) |
| Deferred revenue | �� | �� | 15,988 | �� | �� | �� | 7,801 | �� |
| Operating lease liabilities | �� | �� | (944 | ) | �� | �� | (945 | ) |
| Net cash provided by operating activities | �� | �� | 280 | �� | �� | �� | 10,266 | �� |
| �� | �� | �� | �� | �� | ||||
| Cash flows from investing activities | �� | �� | �� | �� | ||||
| Proceeds from the sale and maturity of short-term investments | �� | �� | 143,208 | �� | �� | �� | 137,000 | �� |
| Purchase of short-term investments | �� | �� | �� | �� | �� | �� | (50,197 | ) |
| Acquisition of businesses, net of cash acquired | �� | �� | (41,122 | ) | �� | �� | �� | �� |
| Capitalization of internal-use software | �� | �� | (4,661 | ) | �� | �� | (2,530 | ) |
| Purchase of intangible assets | �� | �� | �� | �� | �� | �� | (84 | ) |
| Purchases of property and equipment | �� | �� | (670 | ) | �� | �� | (208 | ) |
| Proceeds from the sale of property and equipment | �� | �� | 7 | �� | �� | �� | 3 | �� |
| Net cash provided by investing activities | �� | �� | 96,762 | �� | �� | �� | 83,984 | �� |
| �� | �� | �� | �� | �� | ||||
| Cash flows from financing activities | �� | �� | �� | �� | ||||
| Proceeds from employee stock purchase plan | �� | �� | 695 | �� | �� | �� | 843 | �� |
| Proceeds from exercise of stock options | �� | �� | �� | �� | �� | �� | 20 | �� |
| Repurchase of common stock | �� | �� | (5,000 | ) | �� | �� | �� | �� |
| Repayment of debt | �� | �� | (407 | ) | �� | �� | �� | �� |
| Net cash (used in) provided by financing activities | �� | �� | (4,712 | ) | �� | �� | 863 | �� |
| Effect of exchange rate changes on cash and cash equivalents | �� | �� | (7 | ) | �� | �� | (19 | ) |
| Net increase in cash and cash equivalents | �� | �� | 92,323 | �� | �� | �� | 95,094 | �� |
| �� | �� | �� | �� | �� | ||||
| Cash and cash equivalents at beginning of period | �� | �� | 249,645 | �� | �� | �� | 106,276 | �� |
| Cash and cash equivalents at end of period | �� | $ | 341,968 | �� | �� | $ | 201,370 | �� |
| �� | ||||||||
Non-GAAP Financial Measures
To supplement our financial information presented in accordance with GAAP, we believe certain non-GAAP financial measures, including Adjusted Gross Profit, Adjusted Gross Margin, Adjusted EBITDA, Adjusted Net Income, and Adjusted Net Income per share, basic and diluted, are useful in evaluating our operating performance. For example, we exclude stock-based compensation expense because it is non-cash in nature and excluding this expense provides meaningful supplemental information regarding our operational performance and allows investors the ability to make more meaningful comparisons between our operating results and those of other companies. We use this non-GAAP financial information to evaluate our ongoing operations, as a component in determining employee bonus compensation, and for internal planning and forecasting purposes.
We believe that non-GAAP financial information, when taken collectively, may be helpful to investors because it provides consistency and comparability with past financial performance. However, non-GAAP financial information is presented for supplemental informational purposes only, has limitations as an analytical tool and should not be considered in isolation or as a substitute for financial information presented in accordance with GAAP. In addition, other companies, including companies in our industry, may calculate similarly-titled non-GAAP financial measures differently or may use other measures to evaluate their performance, all of which could reduce the usefulness of our non-GAAP financial measures as tools for comparison. A reconciliation is provided below for each non-GAAP financial measure to the most directly comparable financial measure stated in accordance with GAAP. Investors are encouraged to review the related GAAP financial measures and the reconciliation of these non-GAAP financial measures to their most directly comparable GAAP financial measures, and not to rely on any single financial measure to evaluate our business.
Adjusted��Gross Profit and��Adjusted��Gross Margin
Gross profit is a GAAP financial measure that is calculated as revenue less cost of revenue, including depreciation and amortization of capitalized software development costs and acquired technology. We calculate gross margin as gross profit divided by our revenue. Adjusted��Gross Profit is a��non-GAAP��financial measure that we define as gross profit, adjusted for (i) depreciation and amortization, (ii) stock-based compensation, (iii) acquisition-related costs, net, and (iv) restructuring costs, as applicable. We define��Adjusted��Gross Margin as our��Adjusted��Gross Profit divided by our revenue. We believe��Adjusted��Gross Profit and��Adjusted��Gross Margin are useful to investors as they eliminate the impact of certain��non-cash��expenses and allow a direct comparison of these measures between periods without the impact of��non-cash��expenses and certain other non-recurring operating expenses.
We present both of these measures for our technology and professional services business. We believe these non-GAAP financial measures are useful in evaluating our operating performance compared to that of other companies in our industry, as these metrics generally eliminate the effects of certain items that may vary from company to company for reasons unrelated to overall profitability.
The following is a calculation of our gross profit and gross margin and a reconciliation of gross profit and gross margin, the most directly comparable financial measures calculated in accordance with GAAP, to our Adjusted Gross Profit and Adjusted Gross Margin in total and for technology and professional services for the three months ended March 31, 2025 and 2024.
| �� | �� | Three Months Ended March 31, 2025 | ||||||||||
| �� | �� | (in thousands, except percentages) | ||||||||||
| �� | �� | Technology | �� | Professional Services | �� | Total | ||||||
| Revenue | �� | $ | 51,482 | �� | �� | $ | 27,931 | �� | �� | $ | 79,413 | �� |
| Cost of revenue, excluding depreciation and amortization | �� | �� | (17,565 | ) | �� | �� | (25,613 | ) | �� | �� | (43,178 | ) |
| Amortization of intangible assets, cost of revenue | �� | �� | (4,596 | ) | �� | �� | �� | �� | �� | �� | (4,596 | ) |
| Depreciation of property and equipment, cost of revenue | �� | �� | (2,980 | ) | �� | �� | �� | �� | �� | �� | (2,980 | ) |
| Gross profit | �� | �� | 26,341 | �� | �� | �� | 2,318 | �� | �� | �� | 28,659 | �� |
| Gross margin | �� | �� | 51 | % | �� | �� | 8 | % | �� | �� | 36 | % |
| Add: | �� | �� | �� | �� | �� | �� | ||||||
| Amortization of intangible assets, cost of revenue | �� | �� | 4,596 | �� | �� | �� | �� | �� | �� | �� | 4,596 | �� |
| Depreciation of property and equipment, cost of revenue | �� | �� | 2,980 | �� | �� | �� | �� | �� | �� | �� | 2,980 | �� |
| Stock-based compensation | �� | �� | 219 | �� | �� | �� | 1,002 | �� | �� | �� | 1,221 | �� |
| Acquisition-related costs, net(1) | �� | �� | 74 | �� | �� | �� | 120 | �� | �� | �� | 194 | �� |
| Restructuring costs(2) | �� | �� | 401 | �� | �� | �� | 997 | �� | �� | �� | 1,398 | �� |
| Adjusted Gross Profit | �� | $ | 34,611 | �� | �� | $ | 4,437 | �� | �� | $ | 39,048 | �� |
| Adjusted Gross Margin | �� | �� | 67 | % | �� | �� | 16 | % | �� | �� | 49 | % |
___________________
(1)�� ��Acquisition-related costs, net include deferred retention expenses attributable to the Upfront, Intraprise, ARMUS, and KPI Ninja acquisitions.
(2)�� ��Restructuring costs include severance and other team member costs from workforce reductions. For additional details, refer to Note 19 in our condensed consolidated financial statements.
| �� | �� | Three Months Ended March 31, 2024 | ||||||||||
| �� | �� | (in thousands, except percentages) | ||||||||||
| �� | �� | Technology | �� | Professional Services | �� | Total | ||||||
| Revenue | �� | $ | 46,966 | �� | �� | $ | 27,757 | �� | �� | $ | 74,723 | �� |
| Cost of revenue, excluding depreciation and amortization | �� | �� | (15,315 | ) | �� | �� | (23,202 | ) | �� | �� | (38,517 | ) |
| Amortization of intangible assets, cost of revenue | �� | �� | (4,371 | ) | �� | �� | �� | �� | �� | �� | (4,371 | ) |
| Depreciation of property and equipment, cost of revenue | �� | �� | (2,514 | ) | �� | �� | �� | �� | �� | �� | (2,514 | ) |
| Gross profit | �� | �� | 24,766 | �� | �� | �� | 4,555 | �� | �� | �� | 29,321 | �� |
| Gross margin | �� | �� | 53 | % | �� | �� | 16 | % | �� | �� | 39 | % |
| Add: | �� | �� | �� | �� | �� | �� | ||||||
| Amortization of intangible assets, cost of revenue | �� | �� | 4,371 | �� | �� | �� | �� | �� | �� | �� | 4,371 | �� |
| Depreciation of property and equipment, cost of revenue | �� | �� | 2,514 | �� | �� | �� | �� | �� | �� | �� | 2,514 | �� |
| Stock-based compensation | �� | �� | 365 | �� | �� | �� | 1,332 | �� | �� | �� | 1,697 | �� |
| Acquisition-related costs, net(1) | �� | �� | 65 | �� | �� | �� | 91 | �� | �� | �� | 156 | �� |
| Restructuring costs(2) | �� | �� | 79 | �� | �� | �� | 181 | �� | �� | �� | 260 | �� |
| Adjusted Gross Profit | �� | $ | 32,160 | �� | �� | $ | 6,159 | �� | �� | $ | 38,319 | �� |
| Adjusted Gross Margin | �� | �� | 68 | % | �� | �� | 22 | % | �� | �� | 51 | % |
___________________
(1)�� ��Acquisition-related costs, net include deferred retention expenses attributable to the ARMUS and KPI Ninja acquisitions
(2)�� ��Restructuring costs include severance and other team member costs from workforce reductions. For additional details, refer to Note 19 in our condensed consolidated financial statements.
Adjusted EBITDA
Adjusted EBITDA is a non-GAAP financial measure that we define as net loss adjusted for (i) interest and other (income) expense, net, (ii) income tax provision, (iii) depreciation and amortization, (iv) stock-based compensation, (v) acquisition-related costs, net, (vi) restructuring costs, and (vii) non-recurring lease-related charges. We view acquisition-related expenses when applicable, such as transaction costs and changes in the fair value of contingent consideration liabilities that are directly related to business combinations, as costs that are unpredictable, dependent upon factors outside of our control, and are not necessarily reflective of operational performance during a period. We believe that excluding restructuring costs and non-recurring lease-related charges allows for more meaningful comparisons between operating results from period to period as these are separate from the core activities that arise in the ordinary course of our business and are not part of our ongoing operations. We believe Adjusted EBITDA provides investors with useful information on period-to-period performance as evaluated by management and a comparison with our past financial performance, and is useful in evaluating our operating performance compared to that of other companies in our industry, as this metric generally eliminates the effects of certain items that may vary from company to company for reasons unrelated to overall operating performance. The following is a reconciliation of our net loss, the most directly comparable financial measure calculated in accordance with GAAP, to Adjusted EBITDA for the three months ended March 31, 2025 and 2024:
| �� | �� | Three Months Ended March 31, | ||||||
| �� | �� | �� | 2025 | �� | �� | �� | 2024 | �� |
| �� | �� | (in thousands) | ||||||
| Net loss | �� | $ | (23,742 | ) | �� | $ | (20,587 | ) |
| Add: | �� | �� | �� | �� | ||||
| Interest and other (income) expense, net | �� | �� | 3,356 | �� | �� | �� | (2,338 | ) |
| Income tax provision | �� | �� | 215 | �� | �� | �� | 113 | �� |
| Depreciation and amortization | �� | �� | 12,320 | �� | �� | �� | 10,525 | �� |
| Stock-based compensation | �� | �� | 7,543 | �� | �� | �� | 10,838 | �� |
| Acquisition-related costs, net(1) | �� | �� | 3,029 | �� | �� | �� | 813 | �� |
| Restructuring costs(2) | �� | �� | 3,558 | �� | �� | �� | 1,813 | �� |
| Non-recurring lease-related charges(3) | �� | �� | �� | �� | �� | �� | 2,200 | �� |
| Adjusted EBITDA | �� | $ | 6,279 | �� | �� | $ | 3,377 | �� |
__________________
(1)�� ��Acquisition-related costs, net include third-party fees associated with due diligence, deferred retention expenses, post-acquisition restructuring costs incurred as part of business combinations, and changes in fair value of contingent consideration liabilities for potential earn-out payments.
(2)�� ��Restructuring costs include severance and other team member costs from workforce reductions. For additional details, refer to Note 19 in our condensed consolidated financial statements.
(3)�� ��Non-recurring lease-related charges include the lease-related impairment charge related to our corporate office space designated for subleasing. For additional details, refer to Note 9 in our condensed consolidated financial statements.
Adjusted Net Income and Adjusted Net Income Per Share
Adjusted Net Income is a non-GAAP financial measure that we define as net loss adjusted for (i) stock-based compensation, (ii) amortization of acquired intangibles, (iii) restructuring costs, (iv) acquisition-related costs, net, including the change in fair value of contingent consideration liabilities, (v) non-recurring lease-related charges, and (vi) non-cash interest expense related to debt facilities. We believe Adjusted Net Income provides investors with useful information on period-to-period performance as evaluated by management and comparison with our past financial performance and is useful in evaluating our operating performance compared to that of other companies in our industry, as this metric generally eliminates the effects of certain items that may vary from company to company for reasons unrelated to overall operating performance. The following is a reconciliation of our net loss, the most directly comparable financial measure calculated in accordance with GAAP, to Adjusted Net Income, for the three months ended March 31, 2025 and 2024:
| �� | Three Months Ended March 31, | ||||||
| �� | �� | 2025 | �� | �� | �� | 2024 | �� |
| Numerator: | (in thousands, except share and per share amounts) | ||||||
| Net loss | $ | (23,742 | ) | �� | $ | (20,587 | ) |
| Add: | �� | �� | �� | ||||
| Stock-based compensation . | �� | 7,543 | �� | �� | �� | 10,838 | �� |
| Amortization of acquired intangibles | �� | 8,732 | �� | �� | �� | 7,251 | �� |
| Restructuring costs(1) | �� | 3,558 | �� | �� | �� | 1,813 | �� |
| Acquisition-related costs, net(2) | �� | 3,029 | �� | �� | �� | 813 | �� |
| Non-recurring lease-related charges(3) | �� | �� | �� | �� | �� | 2,200 | �� |
| Non-cash interest expense related to debt facilities . | �� | 1,208 | �� | �� | �� | 379 | �� |
| Adjusted Net Income | $ | 328 | �� | �� | $ | 2,707 | �� |
| Denominator: | �� | �� | �� | ||||
| Weighted-average shares outstanding used in calculating net loss per share, basic and diluted, and Adjusted Net Income per share, basic | �� | 68,552,084 | �� | �� | �� | 58,591,514 | �� |
| Non-GAAP dilutive effect of stock-based awards | �� | 225,507 | �� | �� | �� | 254,323 | �� |
| Non-GAAP weighted-average shares outstanding used in calculating Adjusted Net Income per share, diluted | �� | 68,777,591 | �� | �� | �� | 58,845,837 | �� |
| �� | �� | �� | �� | ||||
| Net loss per share, basic and diluted | $ | (0.35 | ) | �� | $ | (0.35 | ) |
| Adjusted Net Income per share, basic and diluted | $ | 0.01 | �� | �� | $ | 0.05 | �� |
______________
(1)�� ��Restructuring costs include severance and other team member costs from workforce reductions. For additional details, refer to Note 19 in our condensed consolidated financial statements.
(2)�� ��Acquisition-related costs, net includes third-party fees associated with due diligence, deferred retention expenses, post-acquisition restructuring costs incurred as part of business combinations, and changes in fair value of contingent consideration liabilities for potential earn-out payments.
(3)�� ��Non-recurring lease-related charges include the lease-related impairment charge related to our corporate office space designated for subleasing. For additional details, refer to Note 9 in our condensed consolidated financial statements.
Health Catalyst Investor Relations Contact:
Jack Knight
Vice President, Investor Relations
+1 (855)-309-6800
[email protected]
Health Catalyst Media Contact:
Kathryn Mykleseth
Director, Public Relations and Communications
[email protected]
To view this slide as a PDF, please click here:��
