Coastal Financial Corporation Announces Fourth Quarter 2024 Results
Coastal Financial (CCB) reported Q4 2024 net income of $13.4 million ($0.94 per diluted share), compared to $13.5 million ($0.97) in Q3 2024. Full-year 2024 net income was $45.2 million ($3.26 per diluted share) versus $44.6 million ($3.27) in 2023.
Key highlights include completion of a $98.0 million capital raise at $71.00/share during Q4, and strong growth in Banking as a Service (BaaS) program fees, which increased 56.9% year-over-year to $25.6 million. The company sold $845.5 million in loans during Q4 and swept $273.2 million deposits off-balance sheet.
As of December 31, 2024, CCB had three signed letters of intent and 24 total CCBX relationships. The company maintains 98.7% indemnification against credit risk with CCBX partners. Total assets reached $4.12 billion, with loans receivable at $3.49 billion and deposits at $3.59 billion.
Coastal Financial (CCB) ha riportato un utile netto nel quarto trimestre 2024 di 13,4 milioni di dollari (0,94 dollari per azione diluita), rispetto ai 13,5 milioni di dollari (0,97) nel terzo trimestre 2024. L'utile netto annuo per il 2024 è stato di 45,2 milioni di dollari (3,26 dollari per azione diluita) contro i 44,6 milioni di dollari (3,27) nel 2023.
Tra i punti salienti si evidenzia il completamento di un aumento di capitale di 98,0 milioni di dollari a 71,00 dollari per azione durante il quarto trimestre, e una forte crescita delle commissioni del programma Banking as a Service (BaaS), aumentate del 56,9% su base annua a 25,6 milioni di dollari. L'azienda ha venduto prestiti per 845,5 milioni di dollari durante il quarto trimestre e ha ritirato 273,2 milioni di dollari di depositi dal bilancio.
Al 31 dicembre 2024, CCB aveva tre lettere di intenti firmate e 24 relazioni totali CCBX. L'azienda mantiene il 98,7% di indennizzo contro il rischio di credito con i partner CCBX. Gli attivi totali hanno raggiunto 4,12 miliardi di dollari, con prestiti da incassare per 3,49 miliardi di dollari e depositi per 3,59 miliardi di dollari.
Coastal Financial (CCB) reportó un ingreso neto de $13.4 millones ($0.94 por acción diluida) en el cuarto trimestre de 2024, en comparación con $13.5 millones ($0.97) en el tercer trimestre de 2024. El ingreso neto total para 2024 fue de $45.2 millones ($3.26 por acción diluida) frente a $44.6 millones ($3.27) en 2023.
Los puntos destacados incluyen la finalización de una recaudación de capital de $98.0 millones a $71.00/acción durante el cuarto trimestre, y un fuerte crecimiento en las tarifas del programa Banking as a Service (BaaS), que aumentaron un 56.9% interanual a $25.6 millones. La empresa vendió $845.5 millones en préstamos durante el cuarto trimestre y retiró $273.2 millones en depósitos del balance.
Al 31 de diciembre de 2024, CCB tenía tres cartas de intención firmadas y 24 relaciones CCBX en total. La empresa mantiene un 98.7% de indemnización contra el riesgo crediticio con los socios de CCBX. Los activos totales alcanzaron $4.12 mil millones, con préstamos por cobrar de $3.49 mil millones y depósitos de $3.59 mil millones.
코스�� 파이낸셜 (CCB)�� 2024�� 4분기 순이익이 1,340�� 달러(희석 주당 0.94달러)�� 보고했으��, 이는 2024�� 3분기�� 1,350�� 달러(0.97달러)와 비교됩니��. 2024�� 전체 순이익은 4,520�� 달러(희석 주당 3.26달러)��, 2023년의 4,460�� 달러(3.27달러)와 비교됩니��.
주요 하이라이트에�� 2024�� 4분기 동안 주당 71.00달러�� 9,800�� 달러�� 자본 조달 완료와 함께, 뱅킹 서비��(BaaS) 프로그램 요금�� 연평�� 56.9% 증가하여 2,560�� 달러�� 달하�� 것이 포함됩니��. 회사�� 4분기 동안 8�� 4,550�� 달러�� 대출을 판매했으��, 2�� 7,320�� 달러�� 예금�� 대차대조표에서 정리했습니다.
2024�� 12�� 31�� 기준으로, CCB�� �� 개의 서명�� 의향서와 �� 24개의 CCBX 관계를 보유하고 있습니다. �� 회사�� CCBX 파트너와 함께 신용 위험�� 대�� 98.7%�� 면책�� 유지합니��. �� 자산은 41�� 2,000�� 달러�� 도달했으��, 대�� 수취액은 34�� 9,000�� 달러, 예금은 35�� 9,000�� 달러�� 달합니다.
Coastal Financial (CCB) a annoncé un revenu net au quatrième trimestre 2024 de 13,4 millions de dollars (0,94 dollar par action diluée), contre 13,5 millions de dollars (0,97) au troisième trimestre 2024. Le revenu net pour l'année 2024 s'élevait à 45,2 millions de dollars (3,26 dollars par action diluée) contre 44,6 millions de dollars (3,27) en 2023.
Les faits marquants incluent l'achèvement d'une levée de fonds de 98,0 millions de dollars à 71,00 dollars/action au cours du quatrième trimestre, ainsi qu'une forte croissance des frais du programme Banking as a Service (BaaS), qui ont augmenté de 56,9 % d'une année sur l'autre pour atteindre 25,6 millions de dollars. L'entreprise a vendu des prêts pour 845,5 millions de dollars au cours du quatrième trimestre et a retiré 273,2 millions de dollars de dépôts hors bilan.
Au 31 décembre 2024, CCB avait trois lettres d'intention signées et 24 relations CCBX au total. L'entreprise maintient 98,7 % d'indemnisation contre le risque de crédit avec les partenaires CCBX. Les actifs totaux ont atteint 4,12 milliards de dollars, avec des prêts à recevoir de 3,49 milliards de dollars et des dépôts de 3,59 milliards de dollars.
Coastal Financial (CCB) berichtete im vierten Quartal 2024 einen Nettogewinn von 13,4 Millionen Dollar (0,94 Dollar pro verwässerter Aktie), verglichen mit 13,5 Millionen Dollar (0,97) im dritten Quartal 2024. Der Nettogewinn für das Gesamtjahr 2024 betrug 45,2 Millionen Dollar (3,26 Dollar pro verwässerter Aktie) im Vergleich zu 44,6 Millionen Dollar (3,27) im Jahr 2023.
Zu den wesentlichen Ergebnissen gehören der Abschluss einer Kapitalerhöhung in Höhe von 98,0 Millionen Dollar zu 71,00 Dollar/Aktie im vierten Quartal sowie ein starkes Wachstum der Gebühren im Programm Banking as a Service (BaaS), die im Jahresvergleich um 56,9% auf 25,6 Millionen Dollar gestiegen sind. Das Unternehmen verkaufte im vierten Quartal Kredite im Wert von 845,5 Millionen Dollar und zog 273,2 Millionen Dollar an Einlagen aus der Bilanz ab.
Am 31. Dezember 2024 hatte CCB drei unterzeichnete Absichtserklärungen und insgesamt 24 CCBX-Beziehungen. Das Unternehmen hält 98,7% Entschädigung gegen Kreditrisiken mit seinen CCBX-Partnern. Die Gesamtsumme der Vermögenswerte erreichte 4,12 Milliarden Dollar, mit Forderungen aus Darlehen in Höhe von 3,49 Milliarden Dollar und Einlagen von 3,59 Milliarden Dollar.
- Completed $98.0 million capital raise in Q4 2024
- BaaS program fees increased 56.9% YoY to $25.6 million
- Net income increased YoY from $44.6M to $45.2M
- Credit card accounts with fee earning potential increased by 172,400 YoY
- Q4 net income decreased slightly QoQ from $13.5M to $13.4M
- EPS decreased from $0.97 to $0.94 QoQ
- Loan yield decreased 1.14% QoQ
- Nonperforming assets to total assets at 1.52%
Insights
Coastal Financial's Q4 results reveal a strategic transformation focusing on fee-based income and risk management. The
The company's pivot to an asset-light model is evident through the strategic sale of
However, challenges are emerging in loan yields, which decreased
The three signed LOIs and focus on larger, established partners indicate a maturing business model. The reduction in credit risk exposure from
EVERETT, Wash., Jan. 28, 2025 (GLOBE NEWSWIRE) -- Coastal Financial Corporation (Nasdaq: CCB) (the “Company��, "Coastal", "we", "our", or "us"), the holding company for Coastal Community Bank (the “Bank��), through which it operates a community-focused bank with an industry leading banking as a service ("BaaS") segment, today reported unaudited financial results for the quarter ended December��31, 2024, including net income of
Management Discussion of the Quarter and Full-year Results
��2024 was highlighted by the completion of our
Key Points for Fourth Quarter and Our Go-Forward Strategy
- Completed Capital Raise Allows CCBX Growth to Continue. During the fourth quarter of 2024, we completed a
$98.0 million common equity raise, which was priced at$71.00 /share. Proceeds will be used for general corporate purposes and to support growth of the Bank including in our CCBX segment. As of December��31, 2024 we had three signed LOIs and continue to have an active pipeline for 2025. The growth in common-equity tier 1 and total risk-based capital to12.04% and14.67% , respectively, includes the benefit of the capital raise. - Strong Annual Growth in CCBX Program Fees. Total BaaS program fee income was
$25.6 million for the year ended December��31, 2024, an increase of$9.3 million , or56.9% , from the year ended December��31, 2023, and is representative of growth in partner transaction activity and expanded product offerings within our CCBX operating segment. Trends in CCBX noninterest income were also positive during the quarter, with total program fees of$8.2 million for the three months ended December��31, 2024, an increase of$1.8 million , or27.6% , from the three months ended September��30, 2024. - Investments for Growth Continues. Total non-interest expense of
$64.2 million was down$1.4 million , or2.1% , as compared to$65.6 million in the third quarter of 2024, mainly driven by lower BaaS loan expense, partially offset by higher salaries and employee benefits, point of sale expense, and legal and professional expenses. As we increase the number of new CCBX partners and programs launching in 2025, we expect that expenses will tend to be front-loaded with a focus on compliance and operational risk before any new program reaches significant revenues. - Off Balance Sheet Activity Update. During the fourth quarter of 2024, we sold
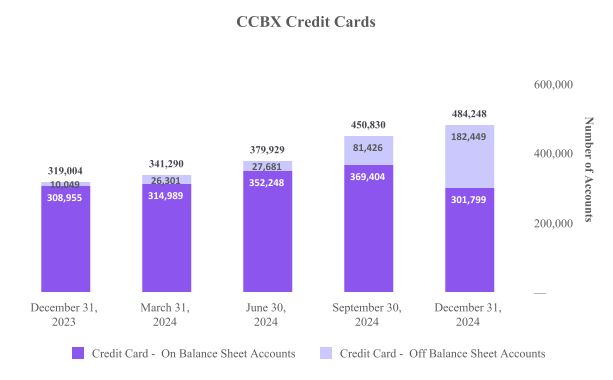
$845.5 million of loans, the majority of which were credit card receivables, and swept$273.2 million of deposits off balance-sheet. We are able to retain a portion of the fee income on these sold credit card loans. As of December��31, 2024 there were 182,449 credit cards with fee earning potential, an increase of 101,023 compared to the quarter ended September��30, 2024 and an increase of 172,400 from December��31, 2023. - Continued Monitoring of CCBX Risk. We remain fully indemnified against fraud and
98.7% indemnified against credit risk with our CCBX partners as of year-end of 2024.
Fourth Quarter 2024 Financial Highlights
The tables below outline some of our key operating metrics.
| �� | Three Months Ended | ||||||||||||||||||
| (Dollars in thousands, except share and per share data; unaudited) | December 31, 2024 | �� | September 30, 2024 | �� | June 30, 2024 | �� | March 31, 2024 | �� | December 31, 2023 | ||||||||||
| Income Statement Data: | �� | �� | �� | �� | �� | �� | �� | �� | �� | ||||||||||
| Interest and dividend income | $ | 96,587 | �� | �� | $ | 105,079 | �� | �� | $ | 97,487 | �� | �� | $ | 90,472 | �� | �� | $ | 88,243 | �� |
| Interest expense | �� | 30,071 | �� | �� | �� | 32,892 | �� | �� | �� | 31,250 | �� | �� | �� | 29,536 | �� | �� | �� | 28,586 | �� |
| Net interest income | �� | 66,516 | �� | �� | �� | 72,187 | �� | �� | �� | 66,237 | �� | �� | �� | 60,936 | �� | �� | �� | 59,657 | �� |
| Provision for credit losses | �� | 61,867 | �� | �� | �� | 70,257 | �� | �� | �� | 62,325 | �� | �� | �� | 83,158 | �� | �� | �� | 60,789 | �� |
| Net interest (expense)/ income after��provision for credit losses | �� | 4,649 | �� | �� | �� | 1,930 | �� | �� | �� | 3,912 | �� | �� | �� | (22,222 | ) | �� | �� | (1,132 | ) |
| Noninterest income | �� | 76,756 | �� | �� | �� | 80,068 | �� | �� | �� | 69,918 | �� | �� | �� | 86,955 | �� | �� | �� | 64,694 | �� |
| Noninterest expense | �� | 64,206 | �� | �� | �� | 65,616 | �� | �� | �� | 58,809 | �� | �� | �� | 56,018 | �� | �� | �� | 51,703 | �� |
| Provision for income tax | �� | 3,832 | �� | �� | �� | 2,926 | �� | �� | �� | 3,425 | �� | �� | �� | 1,915 | �� | �� | �� | 2,847 | �� |
| Net income | �� | 13,367 | �� | �� | �� | 13,456 | �� | �� | �� | 11,596 | �� | �� | �� | 6,800 | �� | �� | �� | 9,012 | �� |
| �� | �� | �� | �� | �� | �� | �� | �� | �� | �� | ||||||||||
| �� | As of and for the Three Month Period | ||||||||||||||||||
| �� | December 31, 2024 | �� | September 30, 2024 | �� | June 30, 2024 | �� | March 31, 2024 | �� | December 31, 2023 | ||||||||||
| Balance Sheet Data: | �� | �� | �� | �� | �� | �� | �� | �� | �� | ||||||||||
| Cash and cash equivalents | $ | 452,513 | �� | �� | $ | 484,026 | �� | �� | $ | 487,245 | �� | �� | $ | 515,128 | �� | �� | $ | 483,128 | �� |
| Investment securities | �� | 47,321 | �� | �� | �� | 48,620 | �� | �� | �� | 49,213 | �� | �� | �� | 50,090 | �� | �� | �� | 150,364 | �� |
| Loans held for sale | �� | 20,600 | �� | �� | �� | 7,565 | �� | �� | �� | �� | �� | �� | �� | 797 | �� | �� | �� | �� | �� |
| Loans receivable | �� | 3,486,565 | �� | �� | �� | 3,418,832 | �� | �� | �� | 3,326,460 | �� | �� | �� | 3,199,554 | �� | �� | �� | 3,026,092 | �� |
| Allowance for credit losses | �� | (176,994 | ) | �� | �� | (170,263 | ) | �� | �� | (147,914 | ) | �� | �� | (139,258 | ) | �� | �� | (116,958 | ) |
| Total assets | �� | 4,121,208 | �� | �� | �� | 4,065,821 | �� | �� | �� | 3,961,546 | �� | �� | �� | 3,865,258 | �� | �� | �� | 3,753,366 | �� |
| Interest bearing deposits | �� | 3,057,808 | �� | �� | �� | 3,047,861 | �� | �� | �� | 2,949,643 | �� | �� | �� | 2,888,867 | �� | �� | �� | 2,735,161 | �� |
| Noninterest bearing deposits | �� | 527,524 | �� | �� | �� | 579,427 | �� | �� | �� | 593,789 | �� | �� | �� | 574,112 | �� | �� | �� | 625,202 | �� |
| Core deposits (1) | �� | 3,123,434 | �� | �� | �� | 3,190,869 | �� | �� | �� | 3,528,339 | �� | �� | �� | 3,447,864 | �� | �� | �� | 3,342,004 | �� |
| Total deposits | �� | 3,585,332 | �� | �� | �� | 3,627,288 | �� | �� | �� | 3,543,432 | �� | �� | �� | 3,462,979 | �� | �� | �� | 3,360,363 | �� |
| Total borrowings | �� | 47,884 | �� | �� | �� | 47,847 | �� | �� | �� | 47,810 | �� | �� | �� | 47,771 | �� | �� | �� | 47,734 | �� |
| Total shareholders�� equity | �� | 438,704 | �� | �� | �� | 331,930 | �� | �� | �� | 316,693 | �� | �� | �� | 303,709 | �� | �� | �� | 294,978 | �� |
| �� | �� | �� | �� | �� | �� | �� | �� | �� | �� | ||||||||||
| Share and Per Share Data (2): | �� | �� | �� | �� | �� | �� | �� | �� | �� | ||||||||||
| Earnings per share �� basic | $ | 0.97 | �� | �� | $ | 1.00 | �� | �� | $ | 0.86 | �� | �� | $ | 0.51 | �� | �� | $ | 0.68 | �� |
| Earnings per share �� diluted | $ | 0.94 | �� | �� | $ | 0.97 | �� | �� | $ | 0.84 | �� | �� | $ | 0.50 | �� | �� | $ | 0.66 | �� |
| Dividends per share | �� | �� | �� | �� | �� | �� | �� | �� | �� | �� | �� | �� | �� | �� | �� | �� | �� | �� | �� |
| Book value per share (3) | $ | 29.37 | �� | �� | $ | 24.51 | �� | �� | $ | 23.54 | �� | �� | $ | 22.65 | �� | �� | $ | 22.17 | �� |
| Tangible book value per share (4) | $ | 29.37 | �� | �� | $ | 24.51 | �� | �� | $ | 23.54 | �� | �� | $ | 22.65 | �� | �� | $ | 22.17 | �� |
| Weighted avg outstanding shares �� basic | �� | 13,828,605 | �� | �� | �� | 13,447,066 | �� | �� | �� | 13,412,667 | �� | �� | �� | 13,340,997 | �� | �� | �� | 13,286,828 | �� |
| Weighted avg outstanding shares �� diluted | �� | 14,268,229 | �� | �� | �� | 13,822,270 | �� | �� | �� | 13,736,508 | �� | �� | �� | 13,676,917 | �� | �� | �� | 13,676,513 | �� |
| Shares outstanding at end of period | �� | 14,935,298 | �� | �� | �� | 13,543,282 | �� | �� | �� | 13,453,805 | �� | �� | �� | 13,407,320 | �� | �� | �� | 13,304,339 | �� |
| Stock options outstanding at end of period | �� | 186,354 | �� | �� | �� | 198,370 | �� | �� | �� | 286,119 | �� | �� | �� | 309,069 | �� | �� | �� | 354,969 | �� |
See footnotes that follow the tables below
| �� | As of and for the Three Month Period | ||||||||||||||||||
| �� | December 31, 2024 | �� | September 30, 2024 | �� | June 30, 2024 | �� | March 31, 2024 | �� | December 31, 2023 | ||||||||||
| Credit Quality Data: | �� | �� | �� | �� | �� | �� | �� | �� | �� | ||||||||||
| Nonperforming assets (5) to total assets | �� | 1.52 | % | �� | �� | 1.63 | % | �� | �� | 1.34 | % | �� | �� | 1.42 | % | �� | �� | 1.43 | % |
| Nonperforming assets (5) to loans receivable and OREO | �� | 1.80 | % | �� | �� | 1.94 | % | �� | �� | 1.60 | % | �� | �� | 1.71 | % | �� | �� | 1.78 | % |
| Nonperforming loans (5) to total loans receivable | �� | 1.80 | % | �� | �� | 1.94 | % | �� | �� | 1.60 | % | �� | �� | 1.71 | % | �� | �� | 1.78 | % |
| Allowance for credit losses to nonperforming loans | �� | 282.5 | % | �� | �� | 256.5 | % | �� | �� | 278.1 | % | �� | �� | 253.8 | % | �� | �� | 217.2 | % |
| Allowance for credit losses to total loans receivable | �� | 5.08 | % | �� | �� | 4.98 | % | �� | �� | 4.45 | % | �� | �� | 4.35 | % | �� | �� | 3.86 | % |
| Gross charge-offs | $ | 61,585 | �� | �� | $ | 53,305 | �� | �� | $ | 55,207 | �� | �� | $ | 58,994 | �� | �� | $ | 47,652 | �� |
| Gross recoveries | $ | 5,646 | �� | �� | $ | 4,069 | �� | �� | $ | 1,973 | �� | �� | $ | 1,776 | �� | �� | $ | 2,781 | �� |
| Net charge-offs to average loans (6) | �� | 6.51 | % | �� | �� | 5.65 | % | �� | �� | 6.57 | % | �� | �� | 7.34 | % | �� | �� | 5.92 | % |
| �� | �� | �� | �� | �� | �� | �� | �� | �� | �� | ||||||||||
| Capital Ratios: | �� | �� | �� | �� | �� | �� | �� | �� | �� | ||||||||||
| Company | �� | �� | �� | �� | �� | �� | �� | �� | �� | ||||||||||
| Tier 1 leverage capital | �� | 10.78 | % | �� | �� | 8.40 | % | �� | �� | 8.31 | % | �� | �� | 8.24 | % | �� | �� | 8.10 | % |
| Common equity Tier 1 risk-based capital | �� | 12.04 | % | �� | �� | 9.24 | % | �� | �� | 9.03 | % | �� | �� | 8.98 | % | �� | �� | 9.10 | % |
| Tier 1 risk-based capital | �� | 12.14 | % | �� | �� | 9.34 | % | �� | �� | 9.13 | % | �� | �� | 9.08 | % | �� | �� | 9.20 | % |
| Total risk-based capital | �� | 14.67 | % | �� | �� | 11.89 | % | �� | �� | 11.70 | % | �� | �� | 11.70 | % | �� | �� | 11.87 | % |
| Bank | �� | �� | �� | �� | �� | �� | �� | �� | �� | ||||||||||
| Tier 1 leverage capital | �� | 10.64 | % | �� | �� | 9.29 | % | �� | �� | 9.24 | % | �� | �� | 9.19 | % | �� | �� | 9.06 | % |
| Common equity Tier 1 risk-based capital | �� | 11.99 | % | �� | �� | 10.34 | % | �� | �� | 10.15 | % | �� | �� | 10.14 | % | �� | �� | 10.30 | % |
| Tier 1 risk-based capital | �� | 11.99 | % | �� | �� | 10.34 | % | �� | �� | 10.15 | % | �� | �� | 10.14 | % | �� | �� | 10.30 | % |
| Total risk-based capital | �� | 13.28 | % | �� | �� | 11.63 | % | �� | �� | 11.44 | % | �� | �� | 11.43 | % | �� | �� | 11.58 | % |
(1)��Core deposits are defined as all deposits excluding brokered and time deposits.
(2)��Share and per share amounts are based on total actual or average common shares outstanding, as applicable.
(3)��We calculate book value per share as total shareholders�� equity at the end of the relevant period divided by the outstanding number of our common shares at the end of each period.
(4)��Tangible book value per share is a non-GAAP financial measure. We calculate tangible book value per share as total shareholders�� equity at the end of the relevant period, less goodwill and other intangible assets, divided by the outstanding number of our common shares at the end of each period. The most directly comparable GAAP financial measure is book value per share. We had no goodwill or other intangible assets as of any of the dates indicated. As a result, tangible book value per share is the same as book value per share as of each of the dates indicated.
(5)��Nonperforming assets and nonperforming loans include loans 90+ days past due and accruing interest.
(6)��Annualized calculations.
Key Performance Ratios
Return on average assets ("ROA") was
Yield on earning assets and yield on loans receivable decreased
The following table shows the Company’s key performance ratios for the periods indicated.����
| �� | �� | Three Months Ended | �� | Twelve Months Ended | ||||||||||
| (unaudited) | �� | December 31, 2024 | �� | September 30, 2024 | �� | June 30, 2024 | �� | March 31, 2024 | �� | December 31, 2023 | �� | December 31, 2024 | �� | December 31, 2023 |
| �� | �� | �� | �� | �� | �� | �� | �� | �� | �� | �� | �� | �� | �� | �� |
| Return on average assets (1) | �� | �� | �� | �� | �� | �� | �� | |||||||
| Return on average equity (1) | �� | �� | �� | �� | �� | �� | �� | |||||||
| Yield on earnings assets (1) | �� | �� | �� | �� | �� | �� | �� | |||||||
| Yield on loans receivable (1) | �� | �� | �� | �� | �� | �� | �� | |||||||
| Cost of funds (1) | �� | �� | �� | �� | �� | �� | �� | |||||||
| Cost of deposits (1) | �� | �� | �� | �� | �� | �� | �� | |||||||
| Net interest margin (1) | �� | �� | �� | �� | �� | �� | �� | |||||||
| Noninterest expense to average assets (1) | �� | �� | �� | �� | �� | �� | �� | |||||||
| Noninterest income to average assets (1) | �� | �� | �� | �� | �� | �� | �� | |||||||
| Efficiency ratio | �� | �� | �� | �� | �� | �� | �� | |||||||
| Loans receivable to deposits (2) | �� | �� | �� | �� | �� | �� | �� | |||||||
(1)��Annualized calculations shown for quarterly periods presented.
(2)��Includes loans held for sale.
Management Outlook; CEO Eric Sprink
“As we look forward to 2025, our strategy involves selectively expanding our current base of CCBX partners while continuing to invest in and enhance our technology and risk management infrastructure. This will enable us to support the next phase of growth within CCBX more efficiently. Additionally, we are focused on growing noninterest income through increased transaction activity and new product offerings with our established partners. We plan to continue selling credit card loans while retaining a portion of the fee income for our role in processing transactions, which offers an additional source of noninterest income without adding on-balance-sheet risk. We believe that by increasing noninterest income, we can mitigate the uncertainties associated with fluctuating interest rates and provide a more stable income stream in the future.�� said CEO Eric Sprink.
Coastal Financial Corporation Overview
The Company has one main subsidiary, the Bank which consists of three segments: CCBX, the community bank and treasury & administration.����The CCBX segment includes all of our BaaS activities, the community bank segment includes all community banking activities, and the treasury & administration segment includes treasury management, overall administration and all other aspects of the Company.����
CCBX Performance Update
Our CCBX segment continues to evolve, and we have 24 relationships, at varying stages, including three signed letters of intent as of December��31, 2024.�� We continue to refine the criteria for CCBX partnerships, exploring relationships with larger more established partners, with experienced management teams, existing customer bases and strong financial positions and will continue to exit relationships where it makes sense for us to do so.
As we explore relationships with new partners we plan to continue expanding product offerings with our existing CCBX partners. As we become more proficient in the BaaS space we aim to cultivate new relationships that align with our long-term goals. We believe that a strategy of adding new partnerships and launching new products with existing partners positions us to reach a wide and established customer base with a modest increase in regulatory risk given that we have already vetted existing partners and have an operational history. Increases in partner activity/transaction counts is positively impacting noninterest income and we expect that trend to continue as products launched earlier in the year gain traction. We plan to continue selling loans as part of our strategy to balance partner and lending limits, and manage the loan portfolio and credit quality. We retain a portion of the fee income for our role in processing transactions on sold credit card balances, and plan to continue this strategy to provide an on-going and passive revenue stream with no on balance sheet risk.
The following table illustrates the activity and evolution in CCBX relationships for the periods presented.
| �� | As of | ||
| (unaudited) | December 31, 2024 | September 30, 2024 | December 31, 2023 |
| Active | 19 | 19 | 19 |
| Friends and family / testing | 1 | 1 | 1 |
| Implementation / onboarding | 1 | 1 | 1 |
| Signed letters of intent | 3 | 1 | 0 |
| Wind down - active but preparing to exit relationship | 0 | 0 | 0 |
| Total CCBX relationships | 24 | 22 | 21 |
| �� | �� | �� | �� |
CCBX loans increased
The following table details the CCBX loan portfolio:
| CCBX | �� | As of | |||||||||||||||||||
| �� | �� | December 31, 2024 | �� | September 30, 2024 | �� | December 31, 2023 | |||||||||||||||
| (dollars in thousands; unaudited) | �� | Balance | �� | % to Total | �� | Balance | �� | % to Total | �� | Balance | �� | % to Total | |||||||||
| Commercial and industrial loans: | �� | �� | �� | �� | �� | �� | �� | �� | �� | �� | �� | �� | |||||||||
| Capital call lines | �� | $ | 109,017 | �� | �� | 6.8 | % | �� | $ | 103,924 | �� | �� | 6.8 | % | �� | $ | 87,494 | �� | �� | 7.3 | % |
| All other commercial & industrial loans | �� | �� | 33,961 | �� | �� | 2.1 | �� | �� | �� | 36,494 | �� | �� | 2.4 | �� | �� | �� | 54,298 | �� | �� | 4.5 | �� |
| AG���˹ٷ� estate loans: | �� | �� | �� | �� | �� | �� | �� | �� | �� | �� | �� | �� | |||||||||
| Residential real estate loans | �� | �� | 267,707 | �� | �� | 16.7 | �� | �� | �� | 265,402 | �� | �� | 17.5 | �� | �� | �� | 238,035 | �� | �� | 19.9 | �� |
| Consumer and other loans: | �� | �� | �� | �� | �� | �� | �� | �� | �� | �� | �� | �� | |||||||||
| Credit cards | �� | �� | 528,554 | �� | �� | 33.0 | �� | �� | �� | 633,691 | �� | �� | 41.6 | �� | �� | �� | 505,837 | �� | �� | 42.3 | �� |
| Other consumer and other loans | �� | �� | 664,780 | �� | �� | 41.4 | �� | �� | �� | 482,228 | �� | �� | 31.7 | �� | �� | �� | 310,574 | �� | �� | 26.0 | �� |
| Gross CCBX loans receivable | �� | �� | 1,604,019 | �� | �� | 100.0 | % | �� | �� | 1,521,739 | �� | �� | 100.0 | % | �� | �� | 1,196,238 | �� | �� | 100.0 | % |
| Net deferred origination (fees) costs | �� | �� | (442 | ) | �� | �� | �� | �� | (447 | ) | �� | �� | �� | �� | (300 | ) | �� | �� | |||
| Loans receivable | �� | $ | 1,603,577 | �� | �� | �� | �� | $ | 1,521,292 | �� | �� | �� | �� | $ | 1,195,938 | �� | �� | �� | |||
| Loan Yield - CCBX (1)(2) | �� | �� | 15.28 | % | �� | �� | �� | �� | 17.35 | % | �� | �� | �� | �� | 17.36 | % | �� | �� | |||
| �� | �� | �� | �� | �� | �� | �� | �� | �� | �� | �� | �� | �� | |||||||||
(1)��CCBX yield does not include the impact of BaaS loan expense.����BaaS loan expense represents the amount paid or payable to partners for credit enhancements and originating & servicing CCBX loans. See reconciliation of the non-GAAP measures at the end of this earnings release for the impact of BaaS loan expense on CCBX loan yield.
(2)��Loan yield is annualized for the three months ended for each period presented and includes loans held for sale and nonaccrual loans.
The increase in CCBX loans in the quarter ended December��31, 2024, includes an increase of
CCBX loan yield decreased
The following chart show the growth in credit card accounts that we are able to generate fee income from. This includes accounts with balances, which are included in our loan totals, and accounts that have been sold and have no corresponding balance in our loan totals, but that we are still able to generate fee income on.
The following table details the CCBX deposit portfolio:
| CCBX | �� | As of | |||||||||||||||||||
| �� | �� | December 31, 2024 | �� | September 30, 2024 | �� | December 31, 2023 | |||||||||||||||
| (dollars in thousands; unaudited) | �� | Balance | �� | % to Total | �� | Balance | �� | % to Total | �� | Balance | �� | % to Total | |||||||||
| Demand, noninterest bearing | �� | $ | 55,686 | �� | �� | 2.7 | % | �� | $ | 60,655 | �� | �� | 2.9 | % | �� | $ | 63,630 | �� | �� | 3.4 | % |
| Interest bearing demand and money market | �� | �� | 1,958,459 | �� | �� | 94.9 | �� | �� | �� | 1,991,858 | �� | �� | 94.6 | �� | �� | �� | 1,794,168 | �� | �� | 96.3 | �� |
| Savings | �� | �� | 5,710 | �� | �� | 0.3 | �� | �� | �� | 5,204 | �� | �� | 0.3 | �� | �� | �� | 4,964 | �� | �� | 0.3 | �� |
| Total core deposits | �� | �� | 2,019,855 | �� | �� | 97.9 | �� | �� | �� | 2,057,717 | �� | �� | 97.8 | �� | �� | �� | 1,862,762 | �� | �� | 100.0 | �� |
| Other deposits | �� | �� | 44,233 | �� | �� | 2.1 | �� | �� | �� | 47,046 | �� | �� | 2.2 | �� | �� | �� | �� | �� | �� | �� | �� |
| Total CCBX deposits | �� | $ | 2,064,088 | �� | �� | 100.0 | % | �� | $ | 2,104,763 | �� | �� | 100.0 | % | �� | $ | 1,862,762 | �� | �� | 100.0 | % |
| Cost of deposits (1) | �� | �� | 4.19 | % | �� | �� | �� | �� | 4.82 | % | �� | �� | �� | �� | 4.90 | % | �� | �� | |||
(1)����Cost of deposits is annualized for the three months ended for each period presented.
CCBX deposits decreased
Community Bank Performance Update
In the quarter ended December��31, 2024, the community bank saw net loans decrease
The following table details the Community Bank loan portfolio:
| Community Bank | �� | As of | |||||||||||||||||||
| �� | �� | December 31, 2024 | �� | September 30, 2024 | �� | December 31, 2023 | |||||||||||||||
| (dollars in thousands; unaudited) | �� | Balance | �� | % to Total | �� | Balance | �� | % to Total | �� | Balance | �� | % to Total | |||||||||
| Commercial and industrial loans | �� | $ | 150,395 | �� | �� | 8.0 | % | �� | $ | 152,161 | �� | �� | 8.0 | % | �� | $ | 149,502 | �� | �� | 8.2 | % |
| AG���˹ٷ� estate loans: | �� | �� | �� | �� | �� | �� | �� | �� | �� | �� | �� | �� | |||||||||
| Construction, land and land development loans | �� | �� | 148,198 | �� | �� | 7.8 | �� | �� | �� | 163,051 | �� | �� | 8.6 | �� | �� | �� | 157,100 | �� | �� | 8.5 | �� |
| Residential real estate loans | �� | �� | 202,064 | �� | �� | 10.7 | �� | �� | �� | 212,467 | �� | �� | 11.2 | �� | �� | �� | 225,391 | �� | �� | 12.3 | �� |
| Commercial real estate loans | �� | �� | 1,374,801 | �� | �� | 72.8 | �� | �� | �� | 1,362,452 | �� | �� | 71.5 | �� | �� | �� | 1,303,533 | �� | �� | 70.9 | �� |
| Consumer and other loans: | �� | �� | �� | �� | �� | �� | �� | �� | �� | �� | �� | �� | |||||||||
| Other consumer and other loans | �� | �� | 13,542 | �� | �� | 0.7 | �� | �� | �� | 14,173 | �� | �� | 0.7 | �� | �� | �� | 1,628 | �� | �� | 0.1 | �� |
| Gross Community Bank loans receivable | �� | �� | 1,889,000 | �� | �� | 100.0 | % | �� | �� | 1,904,304 | �� | �� | 100.0 | % | �� | �� | 1,837,154 | �� | �� | 100.0 | % |
| Net deferred origination fees | �� | �� | (6,012 | ) | �� | �� | �� | �� | (6,764 | ) | �� | �� | �� | �� | (7,000 | ) | �� | �� | |||
| Loans receivable | �� | $ | 1,882,988 | �� | �� | �� | �� | $ | 1,897,540 | �� | �� | �� | �� | $ | 1,830,154 | �� | �� | �� | |||
| Loan Yield(1) | �� | �� | 6.53 | % | �� | �� | �� | �� | 6.64 | % | �� | �� | �� | �� | 6.32 | % | �� | �� | |||
(1)��Loan yield is annualized for the three months ended for each period presented and includes loans held for sale and nonaccrual loans.
Community bank loans decreased
The following table details the community bank deposit portfolio:
| Community Bank | �� | As of | |||||||||||||||||||
| �� | �� | December 31, 2024 | �� | September 30, 2024 | �� | December 31, 2023 | |||||||||||||||
| (dollars in thousands; unaudited) | �� | Balance | �� | % to Total | �� | Balance | �� | % to Total | �� | Balance | �� | % to Total | |||||||||
| Demand, noninterest bearing | �� | $ | 471,838 | �� | �� | 31.0 | % | �� | $ | 518,772 | �� | �� | 34.1 | % | �� | $ | 561,572 | �� | �� | 37.5 | % |
| Interest bearing demand and��money market | �� | �� | 570,625 | �� | �� | 37.5 | �� | �� | �� | 552,108 | �� | �� | 36.3 | �� | �� | �� | 846,072 | �� | �� | 56.5 | �� |
| Savings | �� | �� | 61,116 | �� | �� | 4.0 | �� | �� | �� | 62,272 | �� | �� | 4.1 | �� | �� | �� | 71,598 | �� | �� | 4.8 | �� |
| Total core deposits | �� | �� | 1,103,579 | �� | �� | 72.5 | �� | �� | �� | 1,133,152 | �� | �� | 74.5 | �� | �� | �� | 1,479,242 | �� | �� | 98.8 | �� |
| Other deposits | �� | �� | 400,118 | �� | �� | 26.3 | �� | �� | �� | 373,681 | �� | �� | 24.5 | �� | �� | �� | 1 | �� | �� | 0.0 | �� |
| Time deposits less than | �� | �� | 5,920 | �� | �� | 0.4 | �� | �� | �� | 6,305 | �� | �� | 0.4 | �� | �� | �� | 8,109 | �� | �� | 0.5 | �� |
| Time deposits | �� | �� | 11,627 | �� | �� | 0.8 | �� | �� | �� | 9,387 | �� | �� | 0.6 | �� | �� | �� | 10,249 | �� | �� | 0.7 | �� |
| Total Community Bank deposits | �� | $ | 1,521,244 | �� | �� | 100.0 | % | �� | $ | 1,522,525 | �� | �� | 100.0 | % | �� | $ | 1,497,601 | �� | �� | 100.0 | % |
| Cost of deposits(1) | �� | �� | 1.86 | % | �� | �� | �� | �� | 1.92 | % | �� | �� | �� | �� | 1.57 | % | �� | �� | |||
(1)��Cost of deposits is annualized for the three months ended for each period presented.
Community bank deposits decreased
Net Interest Income and Margin Discussion
Net interest income was
Net interest margin was
The following tables illustrate how net interest margin and loan yield is affected by BaaS loan expense:
| Consolidated | �� | As of and for the Three Months Ended | As of and for the Twelve Months Ended | ||||||||||||||||
| (dollars in thousands; unaudited) | �� | December 31 2024 | �� | September 30 2024 | �� | December 31 2023 | December 31 2024 | �� | December 31 2023 | ||||||||||
| Net interest margin, net of BaaS loan expense: | �� | �� | �� | �� | �� | �� | �� | ||||||||||||
| Net interest margin (1) | �� | �� | 6.65 | % | �� | �� | 7.41 | % | �� | �� | 6.61 | % | �� | 6.99 | % | �� | �� | 7.10 | % |
| Earning assets | �� | �� | 3,980,078 | �� | �� | �� | 3,875,911 | �� | �� | �� | 3,581,772 | �� | �� | 3,802,275 | �� | �� | �� | 3,364,406 | �� |
| Net interest income (GAAP) | �� | �� | 66,516 | �� | �� | �� | 72,187 | �� | �� | �� | 59,657 | �� | �� | 265,876 | �� | �� | �� | 238,727 | �� |
| Less: BaaS loan expense | �� | �� | (24,859 | ) | �� | �� | (32,612 | ) | �� | �� | (24,310 | ) | �� | (111,384 | ) | �� | �� | (86,900 | ) |
| Net interest income, net of BaaS loan expense(2) | �� | $ | 41,657 | �� | �� | $ | 39,575 | �� | �� | $ | 35,347 | �� | $ | 154,492 | �� | �� | $ | 151,827 | �� |
| Net interest margin, net of BaaS loan expense (1)(2) | �� | �� | 4.16 | % | �� | �� | 4.06 | % | �� | �� | 3.92 | % | �� | 4.06 | % | �� | �� | 4.51 | % |
| Loan income net of BaaS loan expense divided by average loans:�� | �� | �� | �� | �� | |||||||||||||||
| Loan yield (GAAP)(1) | �� | �� | 10.44 | % | �� | �� | 11.43 | % | �� | �� | 10.71 | % | �� | 10.99 | % | �� | �� | 10.60 | % |
| Total average loans receivable | �� | $ | 3,419,476 | �� | �� | $ | 3,464,871 | �� | �� | $ | 3,007,289 | �� | $ | 3,320,582 | �� | �� | $ | 2,936,908 | �� |
| Interest and earned fee income on loans (GAAP) | �� | �� | 89,714 | �� | �� | �� | 99,590 | �� | �� | �� | 81,159 | �� | �� | 364,869 | �� | �� | �� | 311,441 | �� |
| BaaS loan expense | �� | �� | (24,859 | ) | �� | �� | (32,612 | ) | �� | �� | (24,310 | ) | �� | (111,384 | ) | �� | �� | (86,900 | ) |
| Net loan income(2) | �� | $ | 64,855 | �� | �� | $ | 66,978 | �� | �� | $ | 56,849 | �� | $ | 253,485 | �� | �� | $ | 224,541 | �� |
| Loan income, net of BaaS loan expense, divided by average loans (1)(2) | �� | �� | 7.55 | % | �� | �� | 7.69 | % | �� | �� | 7.50 | % | �� | 7.63 | % | �� | �� | 7.65 | % |
(1) Annualized calculations shown for periods presented.
(2) A reconciliation of the non-GAAP measures are set forth at the end of this earnings release.
Average investment securities decreased
Cost of funds was
The following table summarizes the average yield on loans receivable and cost of deposits:
| �� | For the Three Months Ended | ||||||||||
| �� | December 31, 2024 | �� | September 30, 2024 | �� | December 31, 2023 | ||||||
| �� | Yield on Loans (2) | �� | Cost of Deposits (2) | �� | Yield on Loans (2) | �� | Cost of Deposits (2) | �� | Yield on Loans (2) | �� | Cost of Deposits (2) |
| Community Bank | �� | �� | �� | �� | �� | ||||||
| CCBX (1) | �� | �� | �� | �� | �� | ||||||
| Consolidated | �� | �� | �� | �� | �� | ||||||
(1)��Annualized calculations for periods shown for credit and fraud enhancements and originating & servicing CCBX loans.����To determine Net BaaS loan��income earned from CCBX loan relationships, the Company takes BaaS loan interest income and deducts BaaS loan expense to arrive at Net BaaS loan income which can be compared to interest income on the Company’s community bank loans. See reconciliation of the non-GAAP measures at the end of this earnings release for the impact of BaaS loan expense on CCBX loan yield.
(2)��Annualized calculations for periods shown.
The following table illustrates how BaaS loan interest income is affected by BaaS loan expense resulting in net BaaS loan income and the associated yield:
| �� | �� | For the Three Months Ended | ||||||||||||||
| �� | �� | December 31, 2024 | �� | September 30, 2024 | �� | December 31, 2023 | ||||||||||
| (dollars in thousands, unaudited) | �� | Income / Expense | �� | Income / expense divided by average CCBX loans (2) | �� | Income / Expense | �� | Income / expense divided by average CCBX loans(2) | �� | Income / Expense | �� | Income / expense divided by average CCBX loans (2) | ||||
| BaaS loan interest income | �� | $ | 58,671 | �� | �� | $ | 67,692 | �� | 17.35 | % | �� | $ | 52,327 | �� | ||
| Less: BaaS loan expense | �� | �� | 24,859 | �� | �� | �� | 32,612 | �� | 8.36 | % | �� | �� | 24,310 | �� | ||
| Net BaaS loan income (1) | �� | $ | 33,812 | �� | �� | $ | 35,080 | �� | 8.99 | % | �� | $ | 28,017 | �� | ||
| Average BaaS Loans(3) | �� | $ | 1,527,178 | �� | �� | �� | $ | 1,552,443 | �� | �� | �� | $ | 1,196,137 | �� | �� | |
(1) A reconciliation of the non-GAAP measures are set forth at the end of this earnings release.
(2) Annualized calculations shown for quarterly periods presented.
(3) Includes loans held for sale.
Noninterest Income Discussion
Noninterest income was
The
Noninterest Expense Discussion
Total noninterest expense decreased
The increase in noninterest expenses for the quarter ended December��31, 2024 compared to the quarter ended December��31, 2023 was largely due to an increase of
Certain noninterest expenses are reimbursed by our CCBX partners. In accordance with GAAP we recognize all expenses in noninterest expense and all reimbursement of expenses from our CCBX partner in noninterest income. The following table reflects the portion of noninterest expenses that are reimbursed by partners to assist the understanding of how the increases in noninterest expense are related to expenses incurred for and reimbursed by CCBX partners:
| �� | �� | Three Months Ended | |||||||
| �� | �� | December 31, | �� | September 30, | �� | December 31, | |||
| (dollars in thousands; unaudited) | �� | 2024 | �� | 2024 | �� | 2023 | |||
| Total noninterest expense (GAAP) | �� | $ | 64,206 | �� | $ | 65,616 | �� | $ | 51,703 |
| Less: BaaS loan expense | �� | �� | 24,859 | �� | �� | 32,612 | �� | �� | 24,310 |
| Less: BaaS fraud expense | �� | �� | 5,043 | �� | �� | 2,084 | �� | �� | 779 |
| Less: Reimbursement of expenses (Baas) | �� | �� | 3,468 | �� | �� | 1,843 | �� | �� | 1,076 |
| Noninterest expense, net of Baas loan expense, BaaS fraud expense��and reimbursement of expenses (BaaS) (1) | �� | $ | 30,836 | �� | $ | 29,077 | �� | $ | 25,538 |
(1) A reconciliation of the non-GAAP measures are set forth at the end of this earnings release.
Provision for Income Taxes
The provision for income taxes was
The Company is subject to various state taxes that are assessed as CCBX activities and employees expand into other states, which has increased the overall tax rate used in calculating the provision for income taxes in the current and future periods. The Company uses a federal statutory tax rate of
Financial Condition Overview
Total assets increased
As of December��31, 2024, the Company had the capacity to borrow up to a total of
The Company completed a
Uninsured deposits were
Total shareholders�� equity as of December��31, 2024 increased
The Company and the Bank remained well capitalized at December��31, 2024, as summarized in the following table.
| (unaudited) | �� | Coastal Community Bank | �� | Coastal Financial Corporation | �� | Minimum Well Capitalized Ratios under Prompt Corrective Action (1) |
| Tier 1 Leverage Capital (to average assets) | �� | �� | �� | |||
| Common Equity Tier 1 Capital (to risk-weighted assets) | �� | �� | �� | |||
| Tier 1 Capital (to risk-weighted assets) | �� | �� | �� | |||
| Total Capital (to risk-weighted assets) | �� | �� | �� |
(1) Presents the minimum capital ratios for an insured depository institution, such as the Bank, to be considered well capitalized under the Prompt Corrective Action framework. The minimum requirements for the Company to be considered well capitalized under Regulation Y include to maintain, on a consolidated basis, a total risk-based capital ratio of 10.0 percent or greater and a tier 1 risk-based capital ratio of 6.0 percent or greater.
Asset Quality
The total allowance for credit losses was
The following table details the allocation of the allowance for credit loss as of the period indicated:
| �� | �� | As of December 31, 2024 | �� | As of September 30, 2024 | �� | As of December 31, 2023 | ||||||||||||||||||||||||||||||
| (dollars in thousands; unaudited) | �� | Community Bank | �� | CCBX | �� | Total | �� | Community Bank | �� | CCBX | �� | Total | �� | Community Bank | �� | CCBX | �� | Total | ||||||||||||||||||
| Loans receivable | �� | $ | 1,882,988 | �� | �� | $ | 1,603,577 | �� | �� | $ | 3,486,565 | �� | �� | $ | 1,897,540 | �� | �� | $ | 1,521,292 | �� | �� | $ | 3,418,832 | �� | �� | $ | 1,830,154 | �� | �� | $ | 1,195,938 | �� | �� | $ | 3,026,092 | �� |
| Allowance for��credit losses | �� | �� | (18,924 | ) | �� | �� | (158,070 | ) | �� | �� | (176,994 | ) | �� | �� | (20,132 | ) | �� | �� | (150,131 | ) | �� | �� | (170,263 | ) | �� | �� | (21,595 | ) | �� | �� | (95,363 | ) | �� | �� | (116,958 | ) |
| Allowance for��credit losses to��total loans��receivable | �� | �� | 1.00 | % | �� | �� | 9.86 | % | �� | �� | 5.08 | % | �� | �� | 1.06 | % | �� | �� | 9.87 | % | �� | �� | 4.98 | % | �� | �� | 1.18 | % | �� | �� | 7.97 | % | �� | �� | 3.86 | % |
| �� | �� | �� | �� | �� | �� | �� | �� | �� | �� | �� | �� | �� | �� | �� | �� | �� | �� | �� | �� | �� | �� | �� | �� | �� | �� | �� | �� | �� | �� | �� | �� | �� | �� | �� | �� | �� |
Net charge-offs totaled
The following table details net charge-offs for the community bank and CCBX for the period indicated:
| �� | �� | Three Months Ended | ||||||||||||||||||||||||||||||||||
| �� | �� | December 31, 2024 | �� | September 30, 2024 | �� | December 31, 2023 | ||||||||||||||||||||||||||||||
| (dollars in thousands; unaudited) | �� | Community Bank | �� | CCBX | �� | Total | �� | Community Bank | �� | CCBX | �� | Total | �� | Community Bank | �� | CCBX | �� | Total | ||||||||||||||||||
| Gross charge-offs | �� | $ | 139 | �� | �� | $ | 61,446 | �� | �� | $ | 61,585 | �� | �� | $ | 398 | �� | �� | $ | 52,907 | �� | �� | $ | 53,305 | �� | �� | $ | 2 | �� | �� | $ | 47,650 | �� | �� | $ | 47,652 | �� |
| Gross recoveries | �� | �� | (3 | ) | �� | �� | (5,643 | ) | �� | �� | (5,646 | ) | �� | �� | (3 | ) | �� | �� | (4,066 | ) | �� | �� | (4,069 | ) | �� | �� | (4 | ) | �� | �� | (2,777 | ) | �� | �� | (2,781 | ) |
| Net charge-offs | �� | $ | 136 | �� | �� | $ | 55,803 | �� | �� | $ | 55,939 | �� | �� | $ | 395 | �� | �� | $ | 48,841 | �� | �� | $ | 49,236 | �� | �� | $ | (2 | ) | �� | $ | 44,873 | �� | �� | $ | 44,871 | �� |
| Net charge-offs to��average loans (1) | �� | �� | 0.03 | % | �� | �� | 14.54 | % | �� | �� | 6.51 | % | �� | �� | 0.08 | % | �� | �� | 12.52 | % | �� | �� | 5.65 | % | �� | �� | 0.00 | % | �� | �� | 14.88 | % | �� | �� | 5.92 | % |
(1) Annualized calculations shown for periods presented.
During the quarter ended December��31, 2024, a
In accordance with accounting guidance, we estimate and record a provision for expected losses for these CCBX loans and reclassified negative deposit accounts. When the provision for CCBX credit losses and provision for unfunded commitments is recorded, a credit enhancement asset is also recorded on the balance sheet through noninterest income (BaaS credit enhancements). Expected losses are recorded in the allowance for credit losses. The credit enhancement asset is relieved when credit enhancement recoveries are received from the CCBX partner. If our partner is unable to fulfill their contracted obligations then the Bank could be exposed to additional credit losses. Management regularly evaluates and manages this counterparty risk.
The factors used in management’s analysis for community bank credit losses indicated that a provision recapture of
The following table details the provision expense/(recapture) for the community bank and CCBX for the period indicated:
| �� | �� | Three Months Ended | |||||||||
| (dollars in thousands; unaudited) | �� | December 31, 2024 | �� | September 30, 2024 | �� | December 31, 2023 | |||||
| Community bank | �� | $ | (1,071 | ) | �� | $ | (519 | ) | �� | $ | 277 |
| CCBX | �� | �� | 63,741 | �� | �� | �� | 72,104 | �� | �� | �� | 60,467 |
| Total provision expense | �� | $ | 62,670 | �� | �� | $ | 71,585 | �� | �� | $ | 60,744 |
A recapture for unfunded commitments of
At December��31, 2024, our nonperforming assets were
Nonperforming assets decreased
For the quarter ended December��31, 2024, there were
The following table details the Company’s nonperforming assets for the periods indicated.
| Consolidated | As of | ||||||||||
| (dollars in thousands; unaudited) | December 31, 2024 | �� | September 30, 2024 | �� | December 31, 2023 | ||||||
| Nonaccrual loans: | �� | �� | �� | �� | �� | ||||||
| Commercial and industrial loans | $ | 334 | �� | �� | $ | 531 | �� | �� | $ | �� | �� |
| AG���˹ٷ� estate loans: | �� | �� | �� | �� | �� | ||||||
| Residential real estate | �� | �� | �� | �� | �� | 44 | �� | �� | �� | 170 | �� |
| Commercial real estate | �� | �� | �� | �� | �� | 831 | �� | �� | �� | 7,145 | �� |
| Consumer and other loans: | �� | �� | �� | �� | �� | ||||||
| Credit cards | �� | 10,262 | �� | �� | �� | 7,987 | �� | �� | �� | �� | �� |
| Other consumer and other loans | �� | 8,967 | �� | �� | �� | 11,713 | �� | �� | �� | �� | �� |
| Total nonaccrual loans | �� | 19,563 | �� | �� | �� | 21,106 | �� | �� | �� | 7,315 | �� |
| Accruing loans past due 90 days or more: | �� | �� | �� | �� | �� | ||||||
| Commercial & industrial loans | �� | 1,006 | �� | �� | �� | 1,566 | �� | �� | �� | 2,086 | �� |
| AG���˹ٷ� estate loans: | �� | �� | �� | �� | �� | ||||||
| Residential real estate loans | �� | 2,608 | �� | �� | �� | 3,025 | �� | �� | �� | 1,115 | �� |
| Consumer and other loans: | �� | �� | �� | �� | �� | ||||||
| Credit cards | �� | 34,490 | �� | �� | �� | 34,562 | �� | �� | �� | 34,835 | �� |
| Other consumer and other loans | �� | 4,989 | �� | �� | �� | 6,111 | �� | �� | �� | 8,488 | �� |
| Total accruing loans past due 90 days or more | �� | 43,093 | �� | �� | �� | 45,264 | �� | �� | �� | 46,524 | �� |
| Total nonperforming loans | �� | 62,656 | �� | �� | �� | 66,370 | �� | �� | �� | 53,839 | �� |
| AG���˹ٷ� estate owned | �� | �� | �� | �� | �� | �� | �� | �� | �� | �� | �� |
| Repossessed assets | �� | �� | �� | �� | �� | �� | �� | �� | �� | �� | �� |
| Total nonperforming assets | $ | 62,656 | �� | �� | $ | 66,370 | �� | �� | $ | 53,839 | �� |
| Total nonaccrual loans to loans receivable | �� | 0.56 | % | �� | �� | 0.62 | % | �� | �� | 0.24 | % |
| Total nonperforming loans to loans receivable | �� | 1.80 | % | �� | �� | 1.94 | % | �� | �� | 1.78 | % |
| Total nonperforming assets to total assets | �� | 1.52 | % | �� | �� | 1.63 | % | �� | �� | 1.43 | % |
| �� | �� | �� | �� | �� | �� | �� | �� | �� | �� | �� | �� |
The following tables detail the CCBX and community bank nonperforming assets which are included in the total nonperforming assets table above.
| CCBX | As of | ||||||||||
| (dollars in thousands; unaudited) | December 31, 2024 | �� | September 30, 2024 | �� | December 31, 2023 | ||||||
| Nonaccrual loans: | �� | �� | �� | �� | �� | ||||||
| Commercial and industrial loans: | �� | �� | �� | �� | �� | ||||||
| All other commercial & industrial loans | $ | 234 | �� | �� | $ | 333 | �� | �� | $ | �� | �� |
| Consumer and other loans: | �� | �� | �� | �� | �� | ||||||
| Credit cards | �� | 10,262 | �� | �� | �� | 7,987 | �� | �� | �� | �� | �� |
| Other consumer and other loans | �� | 8,967 | �� | �� | �� | 11,713 | �� | �� | �� | �� | �� |
| Total nonaccrual loans | �� | 19,463 | �� | �� | �� | 20,033 | �� | �� | �� | �� | �� |
| Accruing loans past due 90 days or more: | �� | �� | �� | �� | �� | ||||||
| Commercial & industrial loans | �� | 1,006 | �� | �� | �� | 1,566 | �� | �� | �� | 2,086 | �� |
| AG���˹ٷ� estate loans: | �� | �� | �� | �� | �� | ||||||
| Residential real estate loans | �� | 2,608 | �� | �� | �� | 3,025 | �� | �� | �� | 1,115 | �� |
| Consumer and other loans: | �� | �� | �� | �� | �� | ||||||
| Credit cards | �� | 34,490 | �� | �� | �� | 34,562 | �� | �� | �� | 34,835 | �� |
| Other consumer and other loans | �� | 4,989 | �� | �� | �� | 6,111 | �� | �� | �� | 8,488 | �� |
| Total accruing loans past due 90 days or more | �� | 43,093 | �� | �� | �� | 45,264 | �� | �� | �� | 46,524 | �� |
| Total nonperforming loans | �� | 62,556 | �� | �� | �� | 65,297 | �� | �� | �� | 46,524 | �� |
| Other real estate owned | �� | �� | �� | �� | �� | �� | �� | �� | �� | �� | �� |
| Repossessed assets | �� | �� | �� | �� | �� | �� | �� | �� | �� | �� | �� |
| Total nonperforming assets | $ | 62,556 | �� | �� | $ | 65,297 | �� | �� | $ | 46,524 | �� |
| Total CCBX nonperforming assets to total consolidated assets | �� | 1.52 | % | �� | �� | 1.61 | % | �� | �� | 1.24 | % |
| Community Bank | As of | |||||||||
| (dollars in thousands; unaudited) | December 31, 2024 | �� | September 30, 2024 | �� | December 31, 2023 | |||||
| Nonaccrual loans: | �� | �� | �� | �� | �� | |||||
| Commercial and industrial loans | $ | 100 | �� | $ | 198 | �� | �� | $ | �� | �� |
| AG���˹ٷ� estate: | �� | �� | �� | �� | �� | |||||
| Residential real estate | �� | �� | �� | �� | 44 | �� | �� | �� | 170 | �� |
| Commercial real estate | �� | �� | �� | �� | 831 | �� | �� | �� | 7,145 | �� |
| Total nonaccrual loans | �� | 100 | �� | �� | 1,073 | �� | �� | �� | 7,315 | �� |
| Accruing loans past due 90 days or more: | �� | �� | �� | �� | �� | |||||
| Total accruing loans past due 90 days or more | �� | �� | �� | �� | �� | �� | �� | �� | �� | �� |
| Total nonperforming loans | �� | 100 | �� | �� | 1,073 | �� | �� | �� | 7,315 | �� |
| Other real estate owned | �� | �� | �� | �� | �� | �� | �� | �� | �� | �� |
| Repossessed assets | �� | �� | �� | �� | �� | �� | �� | �� | �� | �� |
| Total nonperforming assets | $ | 100 | �� | $ | 1,073 | �� | �� | $ | 7,315 | �� |
| Total community bank nonperforming assets to total consolidated assets | < | �� | �� | 0.03 | % | �� | �� | 0.19 | % | |
| �� | �� | �� | �� | �� | �� | �� | �� | �� | �� | |
About Coastal Financial
Coastal Financial Corporation (Nasdaq: CCB) (the “Company��), is an Everett, Washington based bank holding company whose wholly owned subsidiaries are Coastal Community Bank (“Bank��) and Arlington Olympic LLC.����The
CCB-ER
Contact
Eric Sprink, Chief Executive Officer, (425) 357-3659
Joel Edwards, Executive Vice President & Chief Financial Officer, (425) 357-3687
Forward-Looking Statements
This earnings release contains forward-looking statements within the meaning of the Private Securities Litigation Reform Act of 1995. These forward-looking statements reflect our current views with respect to, among other things, future events and our financial performance. Any statements about our management’s expectations, beliefs, plans, predictions, forecasts, objectives, assumptions or future events or performance are not historical facts and may be forward-looking. These statements are often, but not always, made through the use of words or phrases such as “anticipate,�� “believes,�� “can,�� “could,�� “may,�� “predicts,�� “potential,�� “should,�� “will,�� “estimate,�� “plans,�� “projects,�� “continuing,�� “ongoing,�� “expects,�� “intends�� and similar words or phrases. Any or all of the forward-looking statements in this earnings release may turn out to be inaccurate. The inclusion of or reference to forward-looking information in this earnings release should not be regarded as a representation by us or any other person that the future plans, estimates or expectations contemplated by us will be achieved. We have based these forward-looking statements largely on our current expectations and projections about future events and financial trends that we believe may affect our financial condition, results of operations, business strategy and financial needs. Our actual results could differ materially from those anticipated in such forward-looking statements as a result of risks, uncertainties and assumptions that are difficult to predict. Factors that could cause actual results to differ materially from those in the forward-looking statements include, without limitation, the risks and uncertainties discussed under “Risk Factors�� in our Annual Report on Form 10-K for the most recent period filed and in any of our subsequent filings with the Securities and Exchange Commission.
If one or more events related to these or other risks or uncertainties materialize, or if our underlying assumptions prove to be incorrect, actual results may differ materially from what we anticipate. You are cautioned not to place undue reliance on forward-looking statements. Further, any forward-looking statement speaks only as of the date on which it is made, and we undertake no obligation to update or revise any forward-looking statement to reflect events or circumstances after the date on which the statement is made or to reflect the occurrence of unanticipated events, except as required by law.
COASTAL FINANCIAL CORPORATION
CONDENSED CONSOLIDATED STATEMENTS OF FINANCIAL CONDITION
(Dollars in thousands; unaudited)
| ASSETS | |||||||||||||||||||
| �� | December 31, 2024 | �� | September 30, 2024 | �� | June 30, 2024 | �� | March 31, 2024 | �� | December 31, 2023 | ||||||||||
| Cash and due from banks | $ | 36,533 | �� | �� | $ | 45,327 | �� | �� | $ | 59,995 | �� | �� | $ | 32,790 | �� | �� | $ | 31,345 | �� |
| Interest earning deposits with other banks | �� | 415,980 | �� | �� | �� | 438,699 | �� | �� | �� | 427,250 | �� | �� | �� | 482,338 | �� | �� | �� | 451,783 | �� |
| Investment securities, available for sale, at fair value | �� | 35 | �� | �� | �� | 38 | �� | �� | �� | 39 | �� | �� | �� | 41 | �� | �� | �� | 99,504 | �� |
| Investment securities, held to maturity, at amortized cost | �� | 47,286 | �� | �� | �� | 48,582 | �� | �� | �� | 49,174 | �� | �� | �� | 50,049 | �� | �� | �� | 50,860 | �� |
| Other investments | �� | 10,800 | �� | �� | �� | 10,757 | �� | �� | �� | 10,664 | �� | �� | �� | 10,583 | �� | �� | �� | 10,227 | �� |
| Loans held for sale | �� | 20,600 | �� | �� | �� | 7,565 | �� | �� | �� | �� | �� | �� | �� | 797 | �� | �� | �� | �� | �� |
| Loans receivable | �� | 3,486,565 | �� | �� | �� | 3,418,832 | �� | �� | �� | 3,326,460 | �� | �� | �� | 3,199,554 | �� | �� | �� | 3,026,092 | �� |
| Allowance for credit losses | �� | (176,994 | ) | �� | �� | (170,263 | ) | �� | �� | (147,914 | ) | �� | �� | (139,258 | ) | �� | �� | (116,958 | ) |
| Total loans receivable, net | �� | 3,309,571 | �� | �� | �� | 3,248,569 | �� | �� | �� | 3,178,546 | �� | �� | �� | 3,060,296 | �� | �� | �� | 2,909,134 | �� |
| CCBX credit enhancement asset | �� | 181,890 | �� | �� | �� | 167,251 | �� | �� | �� | 143,485 | �� | �� | �� | 137,276 | �� | �� | �� | 107,921 | �� |
| CCBX receivable | �� | 14,138 | �� | �� | �� | 16,060 | �� | �� | �� | 11,520 | �� | �� | �� | 10,369 | �� | �� | �� | 9,088 | �� |
| Premises and equipment, net | �� | 27,431 | �� | �� | �� | 25,833 | �� | �� | �� | 24,526 | �� | �� | �� | 22,995 | �� | �� | �� | 22,090 | �� |
| Lease right-of-use assets | �� | 5,219 | �� | �� | �� | 5,427 | �� | �� | �� | 5,635 | �� | �� | �� | 5,756 | �� | �� | �� | 5,932 | �� |
| Accrued interest receivable | �� | 21,104 | �� | �� | �� | 23,664 | �� | �� | �� | 23,617 | �� | �� | �� | 24,681 | �� | �� | �� | 26,819 | �� |
| Bank-owned life insurance, net | �� | 13,375 | �� | �� | �� | 13,255 | �� | �� | �� | 13,132 | �� | �� | �� | 12,991 | �� | �� | �� | 12,870 | �� |
| Deferred tax asset, net | �� | 3,600 | �� | �� | �� | 3,083 | �� | �� | �� | 2,221 | �� | �� | �� | 2,221 | �� | �� | �� | 3,806 | �� |
| Other assets | �� | 13,646 | �� | �� | �� | 11,711 | �� | �� | �� | 11,742 | �� | �� | �� | 12,075 | �� | �� | �� | 11,987 | �� |
| Total assets | $ | 4,121,208 | �� | �� | $ | 4,065,821 | �� | �� | $ | 3,961,546 | �� | �� | $ | 3,865,258 | �� | �� | $ | 3,753,366 | �� |
| �� | �� | �� | �� | �� | �� | �� | �� | �� | �� | ||||||||||
| LIABILITIES AND SHAREHOLDERS�� EQUITY | |||||||||||||||||||
| LIABILITIES | �� | �� | �� | �� | �� | �� | �� | �� | �� | ||||||||||
| Deposits | $ | 3,585,332 | �� | �� | $ | 3,627,288 | �� | �� | $ | 3,543,432 | �� | �� | $ | 3,462,979 | �� | �� | $ | 3,360,363 | �� |
| Subordinated debt, net | �� | 44,293 | �� | �� | �� | 44,256 | �� | �� | �� | 44,219 | �� | �� | �� | 44,181 | �� | �� | �� | 44,144 | �� |
| Junior subordinated debentures, net | �� | 3,591 | �� | �� | �� | 3,591 | �� | �� | �� | 3,591 | �� | �� | �� | 3,590 | �� | �� | �� | 3,590 | �� |
| Deferred compensation | �� | 332 | �� | �� | �� | 369 | �� | �� | �� | 405 | �� | �� | �� | 442 | �� | �� | �� | 479 | �� |
| Accrued interest payable | �� | 962 | �� | �� | �� | 1,070 | �� | �� | �� | 999 | �� | �� | �� | 1,061 | �� | �� | �� | 892 | �� |
| Lease liabilities | �� | 5,398 | �� | �� | �� | 5,609 | �� | �� | �� | 5,821 | �� | �� | �� | 5,946 | �� | �� | �� | 6,124 | �� |
| CCBX payable | �� | 29,171 | �� | �� | �� | 39,188 | �� | �� | �� | 34,536 | �� | �� | �� | 33,095 | �� | �� | �� | 33,651 | �� |
| Other liabilities | �� | 13,425 | �� | �� | �� | 12,520 | �� | �� | �� | 11,850 | �� | �� | �� | 10,255 | �� | �� | �� | 9,145 | �� |
| Total liabilities | �� | 3,682,504 | �� | �� | �� | 3,733,891 | �� | �� | �� | 3,644,853 | �� | �� | �� | 3,561,549 | �� | �� | �� | 3,458,388 | �� |
| SHAREHOLDERS�� EQUITY | �� | �� | �� | �� | �� | �� | �� | �� | �� | ||||||||||
| Common Stock | �� | 228,177 | �� | �� | �� | 134,769 | �� | �� | �� | 132,989 | �� | �� | �� | 131,601 | �� | �� | �� | 130,136 | �� |
| Retained earnings | �� | 210,529 | �� | �� | �� | 197,162 | �� | �� | �� | 183,706 | �� | �� | �� | 172,110 | �� | �� | �� | 165,311 | �� |
| Accumulated other comprehensive��loss, net of tax | �� | (2 | ) | �� | �� | (1 | ) | �� | �� | (2 | ) | �� | �� | (2 | ) | �� | �� | (469 | ) |
| Total shareholders�� equity | �� | 438,704 | �� | �� | �� | 331,930 | �� | �� | �� | 316,693 | �� | �� | �� | 303,709 | �� | �� | �� | 294,978 | �� |
| Total liabilities and��shareholders�� equity | $ | 4,121,208 | �� | �� | $ | 4,065,821 | �� | �� | $ | 3,961,546 | �� | �� | $ | 3,865,258 | �� | �� | $ | 3,753,366 | �� |
COASTAL FINANCIAL CORPORATION
CONDENSED CONSOLIDATED STATEMENTS OF INCOME
(Dollars in thousands, except per share amounts; unaudited)
| �� | Three Months Ended | ||||||||||||||||
| �� | December 31, 2024 | �� | September 30, 2024 | �� | June 30, 2024 | �� | March 31, 2024 | �� | December 31, 2023 | ||||||||
| INTEREST AND DIVIDEND INCOME | �� | �� | �� | �� | �� | �� | �� | �� | �� | ||||||||
| Interest and fees on loans | $ | 89,714 | �� | $ | 99,590 | �� | $ | 90,944 | �� | �� | $ | 84,621 | �� | �� | $ | 81,159 | �� |
| Interest on interest earning deposits with��other banks | �� | 6,021 | �� | �� | 4,781 | �� | �� | 5,683 | �� | �� | �� | 4,780 | �� | �� | �� | 5,687 | �� |
| Interest on investment securities | �� | 661 | �� | �� | 675 | �� | �� | 686 | �� | �� | �� | 1,034 | �� | �� | �� | 1,225 | �� |
| Dividends on other investments | �� | 191 | �� | �� | 33 | �� | �� | 174 | �� | �� | �� | 37 | �� | �� | �� | 172 | �� |
| Total interest income | �� | 96,587 | �� | �� | 105,079 | �� | �� | 97,487 | �� | �� | �� | 90,472 | �� | �� | �� | 88,243 | �� |
| INTEREST EXPENSE | �� | �� | �� | �� | �� | �� | �� | �� | �� | ||||||||
| Interest on deposits | �� | 29,404 | �� | �� | 32,083 | �� | �� | 30,578 | �� | �� | �� | 28,867 | �� | �� | �� | 27,916 | �� |
| Interest on borrowed funds | �� | 667 | �� | �� | 809 | �� | �� | 672 | �� | �� | �� | 669 | �� | �� | �� | 670 | �� |
| Total interest expense | �� | 30,071 | �� | �� | 32,892 | �� | �� | 31,250 | �� | �� | �� | 29,536 | �� | �� | �� | 28,586 | �� |
| Net interest income | �� | 66,516 | �� | �� | 72,187 | �� | �� | 66,237 | �� | �� | �� | 60,936 | �� | �� | �� | 59,657 | �� |
| PROVISION FOR CREDIT LOSSES | �� | 61,867 | �� | �� | 70,257 | �� | �� | 62,325 | �� | �� | �� | 83,158 | �� | �� | �� | 60,789 | �� |
| Net interest income/(expense) after��provision for credit losses | �� | 4,649 | �� | �� | 1,930 | �� | �� | 3,912 | �� | �� | �� | (22,222 | ) | �� | �� | (1,132 | ) |
| NONINTEREST INCOME | �� | �� | �� | �� | �� | �� | �� | �� | �� | ||||||||
| Service charges and fees | �� | 932 | �� | �� | 952 | �� | �� | 946 | �� | �� | �� | 908 | �� | �� | �� | 957 | �� |
| Loan referral fees | �� | �� | �� | �� | �� | �� | �� | �� | �� | �� | �� | 168 | �� | �� | �� | �� | �� |
| Unrealized gain (loss) on equity securities,��net | �� | 1 | �� | �� | 2 | �� | �� | 9 | �� | �� | �� | 15 | �� | �� | �� | 80 | �� |
| Other income | �� | 473 | �� | �� | 486 | �� | �� | 257 | �� | �� | �� | 308 | �� | �� | �� | 60 | �� |
| Noninterest income, excluding BaaS program income and BaaS indemnification income | �� | 1,406 | �� | �� | 1,440 | �� | �� | 1,212 | �� | �� | �� | 1,399 | �� | �� | �� | 1,097 | �� |
| Servicing and other BaaS fees | �� | 1,043 | �� | �� | 1,044 | �� | �� | 1,525 | �� | �� | �� | 1,131 | �� | �� | �� | 1,015 | �� |
| Transaction fees | �� | 1,783 | �� | �� | 1,696 | �� | �� | 1,309 | �� | �� | �� | 1,122 | �� | �� | �� | 1,006 | �� |
| Interchange fees | �� | 1,916 | �� | �� | 1,853 | �� | �� | 1,625 | �� | �� | �� | 1,539 | �� | �� | �� | 1,272 | �� |
| Reimbursement of expenses | �� | 3,468 | �� | �� | 1,843 | �� | �� | 1,637 | �� | �� | �� | 1,033 | �� | �� | �� | 1,076 | �� |
| BaaS program income | �� | 8,210 | �� | �� | 6,436 | �� | �� | 6,096 | �� | �� | �� | 4,825 | �� | �� | �� | 4,369 | �� |
| BaaS credit enhancements | �� | 62,097 | �� | �� | 70,108 | �� | �� | 60,826 | �� | �� | �� | 79,808 | �� | �� | �� | 58,449 | �� |
| BaaS fraud enhancements | �� | 5,043 | �� | �� | 2,084 | �� | �� | 1,784 | �� | �� | �� | 923 | �� | �� | �� | 779 | �� |
| BaaS indemnification income | �� | 67,140 | �� | �� | 72,192 | �� | �� | 62,610 | �� | �� | �� | 80,731 | �� | �� | �� | 59,228 | �� |
| Total noninterest income | �� | 76,756 | �� | �� | 80,068 | �� | �� | 69,918 | �� | �� | �� | 86,955 | �� | �� | �� | 64,694 | �� |
| NONINTEREST EXPENSE | �� | �� | �� | �� | �� | �� | �� | �� | �� | ||||||||
| Salaries and employee benefits | �� | 17,994 | �� | �� | 17,101 | �� | �� | 17,005 | �� | �� | �� | 17,984 | �� | �� | �� | 16,490 | �� |
| Occupancy | �� | 958 | �� | �� | 964 | �� | �� | 985 | �� | �� | �� | 1,029 | �� | �� | �� | 976 | �� |
| Data processing and software licenses | �� | 4,010 | �� | �� | 4,297 | �� | �� | 3,625 | �� | �� | �� | 3,381 | �� | �� | �� | 2,781 | �� |
| Legal and professional expenses | �� | 4,606 | �� | �� | 3,597 | �� | �� | 3,631 | �� | �� | �� | 3,672 | �� | �� | �� | 2,649 | �� |
| Point of sale expense | �� | 2,745 | �� | �� | 1,351 | �� | �� | 852 | �� | �� | �� | 869 | �� | �� | �� | 899 | �� |
| Excise taxes | �� | 778 | �� | �� | 762 | �� | �� | (706 | ) | �� | �� | 320 | �� | �� | �� | 449 | �� |
| Federal Deposit Insurance Corporation��("FDIC") assessments | �� | 750 | �� | �� | 740 | �� | �� | 690 | �� | �� | �� | 683 | �� | �� | �� | 665 | �� |
| Director and staff expenses | �� | 683 | �� | �� | 559 | �� | �� | 470 | �� | �� | �� | 400 | �� | �� | �� | 478 | �� |
| Marketing | �� | 28 | �� | �� | 67 | �� | �� | 14 | �� | �� | �� | 53 | �� | �� | �� | 138 | �� |
| Other expense | �� | 1,752 | �� | �� | 1,482 | �� | �� | 1,383 | �� | �� | �� | 1,867 | �� | �� | �� | 1,089 | �� |
| Noninterest expense, excluding BaaS loan and BaaS fraud expense | �� | 34,304 | �� | �� | 30,920 | �� | �� | 27,949 | �� | �� | �� | 30,258 | �� | �� | �� | 26,614 | �� |
| BaaS loan expense | �� | 24,859 | �� | �� | 32,612 | �� | �� | 29,076 | �� | �� | �� | 24,837 | �� | �� | �� | 24,310 | �� |
| BaaS fraud expense | �� | 5,043 | �� | �� | 2,084 | �� | �� | 1,784 | �� | �� | �� | 923 | �� | �� | �� | 779 | �� |
| BaaS loan and fraud expense | �� | 29,902 | �� | �� | 34,696 | �� | �� | 30,860 | �� | �� | �� | 25,760 | �� | �� | �� | 25,089 | �� |
| Total noninterest expense | �� | 64,206 | �� | �� | 65,616 | �� | �� | 58,809 | �� | �� | �� | 56,018 | �� | �� | �� | 51,703 | �� |
| Income before provision for income��taxes | �� | 17,199 | �� | �� | 16,382 | �� | �� | 15,021 | �� | �� | �� | 8,715 | �� | �� | �� | 11,859 | �� |
| PROVISION FOR INCOME TAXES | �� | 3,832 | �� | �� | 2,926 | �� | �� | 3,425 | �� | �� | �� | 1,915 | �� | �� | �� | 2,847 | �� |
| NET INCOME | $ | 13,367 | �� | $ | 13,456 | �� | $ | 11,596 | �� | �� | $ | 6,800 | �� | �� | $ | 9,012 | �� |
| Basic earnings per common share | $ | 0.97 | �� | $ | 1.00 | �� | $ | 0.86 | �� | �� | $ | 0.51 | �� | �� | $ | 0.68 | �� |
| Diluted earnings per common share | $ | 0.94 | �� | $ | 0.97 | �� | $ | 0.84 | �� | �� | $ | 0.50 | �� | �� | $ | 0.66 | �� |
| Weighted average number of common shares��outstanding: | �� | �� | �� | �� | �� | �� | �� | �� | �� | ||||||||
| Basic | �� | 13,828,605 | �� | �� | 13,447,066 | �� | �� | 13,412,667 | �� | �� | �� | 13,340,997 | �� | �� | �� | 13,286,828 | �� |
| Diluted | �� | 14,268,229 | �� | �� | 13,822,270 | �� | �� | 13,736,508 | �� | �� | �� | 13,676,917 | �� | �� | �� | 13,676,513 | �� |
COASTAL FINANCIAL CORPORATION
AVERAGE BALANCES, YIELDS, AND RATES �� QUARTERLY
(Dollars in thousands; unaudited)
| �� | For the Three Months Ended | ||||||||||||||||||||||||||||
| �� | December 31, 2024 | �� | September 30, 2024 | �� | December 31, 2023 | ||||||||||||||||||||||||
| �� | Average Balance | �� | Interest & Dividends | �� | Yield / Cost (1) | �� | Average Balance | �� | Interest & Dividends | �� | Yield / Cost (1) | �� | Average Balance | �� | Interest & Dividends | �� | Yield / Cost (1) | ||||||||||||
| Assets | �� | �� | �� | �� | �� | �� | �� | �� | �� | �� | �� | �� | �� | �� | �� | �� | �� | ||||||||||||
| Interest earning assets: | �� | �� | �� | �� | �� | �� | �� | �� | �� | �� | �� | �� | �� | �� | �� | �� | �� | ||||||||||||
| Interest earning deposits with��other banks | $ | 501,654 | �� | �� | $ | 6,021 | �� | 4.77 | % | �� | $ | 350,915 | �� | �� | $ | 4,781 | �� | 5.42 | % | �� | $ | 413,127 | �� | �� | $ | 5,687 | �� | 5.46 | % |
| Investment securities, available for sale (2) | �� | 39 | �� | �� | �� | �� | �� | �� | �� | �� | �� | 40 | �� | �� | �� | �� | �� | �� | �� | �� | �� | 100,204 | �� | �� | �� | 546 | �� | 2.16 | �� |
| Investment securities, held to maturity (2) | �� | 48,126 | �� | �� | �� | 661 | �� | 5.46 | �� | �� | �� | 48,945 | �� | �� | �� | 675 | �� | 5.49 | �� | �� | �� | 49,469 | �� | �� | �� | 679 | �� | 5.45 | �� |
| Other investments | �� | 10,783 | �� | �� | �� | 191 | �� | 7.05 | �� | �� | �� | 11,140 | �� | �� | �� | 33 | �� | 1.18 | �� | �� | �� | 11,683 | �� | �� | �� | 172 | �� | 5.84 | �� |
| Loans receivable (3) | �� | 3,419,476 | �� | �� | �� | 89,714 | �� | 10.44 | �� | �� | �� | 3,464,871 | �� | �� | �� | 99,590 | �� | 11.43 | �� | �� | �� | 3,007,289 | �� | �� | �� | 81,159 | �� | 10.71 | �� |
| Total interest earning assets | �� | 3,980,078 | �� | �� | �� | 96,587 | �� | 9.65 | �� | �� | �� | 3,875,911 | �� | �� | �� | 105,079 | �� | 10.79 | �� | �� | �� | 3,581,772 | �� | �� | �� | 88,243 | �� | 9.77 | �� |
| Noninterest earning assets: | �� | �� | �� | �� | �� | �� | �� | �� | �� | �� | �� | �� | �� | �� | �� | �� | �� | ||||||||||||
| Allowance for credit losses | �� | (156,687 | ) | �� | �� | �� | �� | �� | �� | (151,292 | ) | �� | �� | �� | �� | �� | �� | (95,391 | ) | �� | �� | �� | �� | ||||||
| Other noninterest earning assets | �� | 277,922 | �� | �� | �� | �� | �� | �� | �� | 268,903 | �� | �� | �� | �� | �� | �� | �� | 204,052 | �� | �� | �� | �� | �� | ||||||
| Total assets | $ | 4,101,313 | �� | �� | �� | �� | �� | �� | $ | 3,993,522 | �� | �� | �� | �� | �� | �� | $ | 3,690,433 | �� | �� | �� | �� | �� | ||||||
| �� | �� | �� | �� | �� | �� | �� | �� | �� | �� | �� | �� | �� | �� | �� | �� | �� | �� | ||||||||||||
| Liabilities and Shareholders�� Equity | �� | �� | �� | �� | �� | �� | �� | �� | �� | �� | �� | �� | �� | �� | �� | �� | �� | ||||||||||||
| Interest bearing liabilities: | �� | �� | �� | �� | �� | �� | �� | �� | �� | �� | �� | �� | �� | �� | �� | �� | �� | ||||||||||||
| Interest bearing deposits | $ | 3,068,357 | �� | �� | $ | 29,404 | �� | 3.81 | % | �� | $ | 2,966,527 | �� | �� | $ | 32,083 | �� | 4.30 | % | �� | $ | 2,660,235 | �� | �� | $ | 27,916 | �� | 4.16 | % |
| FHLB advances and other borrowings | �� | �� | �� | �� | �� | 1 | �� | �� | �� | �� | �� | 9,717 | �� | �� | �� | 140 | �� | 5.73 | �� | �� | �� | 3 | �� | �� | �� | �� | �� | �� | �� |
| Subordinated debt | �� | 44,272 | �� | �� | �� | 599 | �� | 5.38 | �� | �� | �� | 44,234 | �� | �� | �� | 598 | �� | 5.38 | �� | �� | �� | 44,121 | �� | �� | �� | 598 | �� | 5.38 | �� |
| Junior subordinated debentures | �� | 3,591 | �� | �� | �� | 67 | �� | 7.42 | �� | �� | �� | 3,591 | �� | �� | �� | 71 | �� | 7.87 | �� | �� | �� | 3,590 | �� | �� | �� | 72 | �� | 7.96 | �� |
| Total interest bearing liabilities | �� | 3,116,220 | �� | �� | �� | 30,071 | �� | 3.84 | �� | �� | �� | 3,024,069 | �� | �� | �� | 32,892 | �� | 4.33 | �� | �� | �� | 2,707,949 | �� | �� | �� | 28,586 | �� | 4.19 | �� |
| Noninterest bearing deposits | �� | 577,453 | �� | �� | �� | �� | �� | �� | �� | 588,178 | �� | �� | �� | �� | �� | �� | �� | 640,424 | �� | �� | �� | �� | �� | ||||||
| Other liabilities | �� | 50,824 | �� | �� | �� | �� | �� | �� | �� | 60,101 | �� | �� | �� | �� | �� | �� | �� | 52,450 | �� | �� | �� | �� | �� | ||||||
| Total shareholders' equity | �� | 356,816 | �� | �� | �� | �� | �� | �� | �� | 321,174 | �� | �� | �� | �� | �� | �� | �� | 289,612 | �� | �� | �� | �� | �� | ||||||
| Total liabilities and shareholders' equity | $ | 4,101,313 | �� | �� | �� | �� | �� | �� | $ | 3,993,522 | �� | �� | �� | �� | �� | �� | $ | 3,690,435 | �� | �� | �� | �� | �� | ||||||
| Net interest income | �� | �� | $ | 66,516 | �� | �� | �� | �� | �� | $ | 72,187 | �� | �� | �� | �� | �� | $ | 59,657 | �� | �� | |||||||||
| Interest rate spread | �� | �� | �� | �� | 5.82 | % | �� | �� | �� | �� | �� | 6.46 | % | �� | �� | �� | �� | �� | 5.59 | % | |||||||||
| Net interest margin (4) | �� | �� | �� | �� | 6.65 | % | �� | �� | �� | �� | �� | 7.41 | % | �� | �� | �� | �� | �� | 6.61 | % | |||||||||
(1)��Yields and costs are annualized.
(2)��For presentation in this table, average balances and the corresponding average rates for investment securities are based upon historical cost, adjusted for amortization of premiums and accretion of discounts.
(3)��Includes loans held for sale and nonaccrual loans.
(4)��Net interest margin represents net interest income divided by the average total interest earning assets.
COASTAL FINANCIAL CORPORATION
SELECTED AVERAGE BALANCES, YIELDS, AND RATES �� BY SEGMENT - QUARTERLY
(Dollars in thousands; unaudited)
| �� | For the Three Months Ended | |||||||||||||||||||||||||
| �� | December 31, 2024 | �� | September 30, 2024 | �� | December 31, 2023 | |||||||||||||||||||||
| (dollars in thousands, unaudited) | Average Balance | �� | Interest & Dividends | �� | Yield / Cost (1) | �� | Average Balance | �� | Interest & Dividends | �� | Yield / Cost (1) | �� | Average Balance | �� | Interest & Dividends | �� | Yield / Cost (1) | |||||||||
| Community Bank | �� | �� | �� | �� | �� | �� | �� | �� | �� | �� | �� | �� | �� | �� | �� | �� | �� | |||||||||
| Assets | �� | �� | �� | �� | �� | �� | �� | �� | �� | �� | �� | �� | �� | �� | �� | �� | �� | |||||||||
| Interest earning assets: | �� | �� | �� | �� | �� | �� | �� | �� | �� | �� | �� | �� | �� | �� | �� | �� | �� | |||||||||
| Loans receivable (2) | $ | 1,892,298 | �� | $ | 31,043 | �� | 6.53 | % | �� | $ | 1,912,428 | �� | $ | 31,898 | �� | 6.64 | % | �� | $ | 1,811,152 | �� | $ | 28,832 | �� | 6.32 | % |
| Total interest earning��assets | �� | 1,892,298 | �� | �� | 31,043 | �� | 6.53 | �� | �� | �� | 1,912,428 | �� | �� | 31,898 | �� | 6.64 | �� | �� | �� | 1,811,152 | �� | �� | 28,832 | �� | 6.32 | �� |
| Liabilities | �� | �� | �� | �� | �� | �� | �� | �� | �� | �� | �� | �� | �� | �� | �� | �� | �� | |||||||||
| Interest bearing liabilities: | �� | �� | �� | �� | �� | �� | �� | �� | �� | �� | �� | �� | �� | �� | �� | �� | ||||||||||
| Interest bearing��deposits | �� | 1,029,346 | �� | �� | 7,161 | �� | 2.77 | % | �� | �� | 982,280 | �� | �� | 7,264 | �� | 2.94 | % | �� | �� | 951,148 | �� | �� | 6,090 | �� | 2.54 | % |
| Intrabank liability | �� | 357,442 | �� | �� | 4,290 | �� | 4.77 | �� | �� | �� | 406,641 | �� | �� | 5,540 | �� | 5.42 | �� | �� | �� | 275,995 | �� | �� | 3,799 | �� | 5.46 | �� |
| Total interest bearing��liabilities | �� | 1,386,788 | �� | �� | 11,451 | �� | 3.28 | �� | �� | �� | 1,388,921 | �� | �� | 12,804 | �� | 3.67 | �� | �� | �� | 1,227,143 | �� | �� | 9,889 | �� | 3.20 | �� |
| Noninterest bearing��deposits | �� | 505,510 | �� | �� | �� | �� | �� | �� | 523,507 | �� | �� | �� | �� | �� | �� | 584,009 | �� | �� | �� | �� | ||||||
| Net interest income | �� | �� | $ | 19,592 | �� | �� | �� | �� | �� | $ | 19,094 | �� | �� | �� | �� | �� | $ | 18,943 | �� | �� | ||||||
| Net interest margin(3) | �� | �� | �� | �� | 4.12 | % | �� | �� | �� | �� | �� | 3.97 | % | �� | �� | �� | �� | �� | 4.15 | % | ||||||
| �� | �� | �� | �� | �� | �� | �� | �� | �� | �� | �� | �� | �� | �� | �� | �� | �� | �� | |||||||||
| CCBX | �� | �� | �� | �� | �� | �� | �� | �� | �� | �� | �� | �� | �� | �� | �� | �� | �� | |||||||||
| Assets | �� | �� | �� | �� | �� | �� | �� | �� | �� | �� | �� | �� | �� | �� | �� | �� | �� | |||||||||
| Interest earning assets: | �� | �� | �� | �� | �� | �� | �� | �� | �� | �� | �� | �� | �� | �� | �� | �� | �� | |||||||||
| Loans receivable (2)(4) | $ | 1,527,178 | �� | $ | 58,671 | �� | 15.28 | % | �� | $ | 1,552,443 | �� | $ | 67,692 | �� | 17.35 | % | �� | $ | 1,196,137 | �� | $ | 52,327 | �� | 17.36 | % |
| Intrabank asset | �� | 583,776 | �� | �� | 7,007 | �� | 4.78 | �� | �� | �� | 496,475 | �� | �� | 6,764 | �� | 5.42 | �� | �� | �� | 569,365 | �� | �� | 7,837 | �� | 5.46 | �� |
| Total interest earning��assets | �� | 2,110,954 | �� | �� | 65,678 | �� | 12.38 | �� | �� | �� | 2,048,918 | �� | �� | 74,456 | �� | 14.46 | �� | �� | �� | 1,765,502 | �� | �� | 60,164 | �� | 13.52 | �� |
| Liabilities | �� | �� | �� | �� | �� | �� | �� | �� | �� | �� | �� | �� | �� | �� | �� | �� | �� | |||||||||
| Interest bearing liabilities: | �� | �� | �� | �� | �� | �� | �� | �� | �� | �� | �� | �� | �� | �� | ||||||||||||
| Interest bearing��deposits | �� | 2,039,011 | �� | �� | 22,243 | �� | 4.34 | % | �� | �� | 1,984,247 | �� | �� | 24,819 | �� | 4.98 | % | �� | �� | 1,709,087 | �� | �� | 21,826 | �� | 5.07 | % |
| Total interest bearing��liabilities | �� | 2,039,011 | �� | �� | 22,243 | �� | 4.34 | �� | �� | �� | 1,984,247 | �� | �� | 24,819 | �� | 4.98 | �� | �� | �� | 1,709,087 | �� | �� | 21,826 | �� | 5.07 | �� |
| Noninterest bearing��deposits | �� | 71,943 | �� | �� | �� | �� | �� | �� | 64,671 | �� | �� | �� | �� | �� | �� | 56,415 | �� | �� | �� | �� | ||||||
| Net interest income | �� | �� | $ | 43,435 | �� | �� | �� | �� | �� | $ | 49,637 | �� | �� | �� | �� | �� | $ | 38,338 | �� | �� | ||||||
| Net interest margin(3) | �� | �� | �� | �� | 8.19 | % | �� | �� | �� | �� | �� | 9.64 | % | �� | �� | �� | �� | �� | 8.62 | % | ||||||
| Net interest margin, net��of Baas loan expense (5) | �� | �� | �� | �� | 3.50 | % | �� | �� | �� | �� | �� | 3.31 | % | �� | �� | �� | �� | �� | 3.15 | % | ||||||
| �� | For the Three Months Ended | |||||||||||||||||||||||||
| �� | December 31, 2024 | �� | September 30, 2024 | �� | December 31, 2023 | |||||||||||||||||||||
| (dollars in thousands, unaudited) | Average Balance | �� | Interest & Dividends | �� | Yield / Cost (1) | �� | Average Balance | �� | Interest & Dividends | �� | Yield / Cost (1) | �� | Average Balance | �� | Interest & Dividends | �� | Yield / Cost (1) | |||||||||
| Treasury & Administration | �� | �� | �� | �� | �� | �� | �� | �� | �� | �� | �� | �� | �� | �� | ||||||||||||
| Assets | �� | �� | �� | �� | �� | �� | �� | �� | �� | �� | �� | �� | �� | �� | �� | �� | �� | |||||||||
| Interest earning assets: | �� | �� | �� | �� | �� | �� | �� | �� | �� | �� | �� | �� | �� | �� | �� | �� | �� | |||||||||
| Interest earning��deposits with��other banks | $ | 501,654 | �� | $ | 6,021 | �� | 4.77 | % | �� | $ | 350,915 | �� | $ | 4,781 | �� | 5.42 | % | �� | $ | 413,127 | �� | $ | 5,687 | �� | 5.46 | % |
| Investment securities,��available for sale (6) | �� | 39 | �� | �� | �� | �� | �� | �� | �� | �� | 40 | �� | �� | �� | �� | �� | �� | �� | �� | 100,204 | �� | �� | 546 | �� | 2.16 | �� |
| Investment securities,��held to maturity (6) | �� | 48,126 | �� | �� | 661 | �� | 5.46 | �� | �� | �� | 48,945 | �� | �� | 675 | �� | 5.49 | �� | �� | �� | 49,469 | �� | �� | 679 | �� | 5.45 | �� |
| Other investments | �� | 10,783 | �� | �� | 191 | �� | 7.05 | �� | �� | �� | 11,140 | �� | �� | 33 | �� | 1.18 | �� | �� | �� | 11,683 | �� | �� | 172 | �� | 5.84 | �� |
| Total interest��earning assets | �� | 560,602 | �� | �� | 6,873 | �� | 4.88 | % | �� | �� | 411,040 | �� | �� | 5,489 | �� | 5.31 | % | �� | �� | 574,483 | �� | �� | 7,084 | �� | 4.89 | % |
| Liabilities | �� | �� | �� | �� | �� | �� | �� | �� | �� | �� | �� | �� | �� | �� | �� | �� | �� | |||||||||
| Interest bearing��liabilities: | �� | �� | �� | �� | �� | �� | �� | �� | �� | �� | �� | �� | �� | �� | �� | �� | �� | |||||||||
| FHLB advances��and borrowings | $ | �� | �� | $ | 1 | �� | �� | % | �� | �� | 9,717 | �� | �� | 140 | �� | 5.73 | % | �� | �� | 3 | �� | �� | �� | �� | �� | % |
| Subordinated debt | �� | 44,272 | �� | �� | 599 | �� | 5.38 | % | �� | �� | 44,234 | �� | �� | 598 | �� | 5.38 | % | �� | �� | 44,121 | �� | �� | 598 | �� | 5.38 | % |
| Junior subordinated��debentures | �� | 3,591 | �� | �� | 67 | �� | 7.42 | �� | �� | �� | 3,591 | �� | �� | 71 | �� | 7.87 | �� | �� | �� | 3,590 | �� | �� | 72 | �� | 7.96 | �� |
| Intrabank liability, net (7) | �� | 226,334 | �� | �� | 2,717 | �� | 4.78 | �� | �� | �� | 89,834 | �� | �� | 1,224 | �� | 5.42 | �� | �� | �� | 293,370 | �� | �� | 4,038 | �� | 5.46 | �� |
| Total interest��bearing liabilities | �� | 274,197 | �� | �� | 3,384 | �� | 4.91 | �� | �� | �� | 147,376 | �� | �� | 2,033 | �� | 5.49 | �� | �� | �� | 341,084 | �� | �� | 4,708 | �� | 5.48 | �� |
| Net interest income | �� | �� | $ | 3,489 | �� | �� | �� | �� | �� | $ | 3,456 | �� | �� | �� | �� | �� | $ | 2,376 | �� | �� | ||||||
| Net interest margin(3) | �� | �� | �� | �� | 2.48 | % | �� | �� | �� | �� | �� | 3.34 | % | �� | �� | �� | �� | �� | 1.64 | % | ||||||
(1)��Yields and costs are annualized.
(2)��Includes loans held for sale and nonaccrual loans.
(3)��Net interest margin represents net interest income divided by the average total interest earning assets.
(4)��CCBX yield does not include the impact of BaaS loan expense. BaaS loan expense represents the amount paid or payable to partners for credit enhancements, fraud enhancements and originating & servicing CCBX loans. See reconciliation of the non-GAAP measures at the end of this earnings release for the impact of BaaS loan expense on CCBX loan yield.
(5)��Net interest margin, net of BaaS loan expense, includes the impact of BaaS loan expense. BaaS loan expense represents the amount paid or payable to partners for credit enhancements, fraud enhancements, originating & servicing CCBX loans. See reconciliation of the non-GAAP measures at the end of this earnings release.
(6)��For presentation in this table, average balances and the corresponding average rates for investment securities are based upon historical cost, adjusted for amortization of premiums and accretion of discounts.
(7)��Intrabank assets and liabilities are consolidated for period calculations and presented as intrabank asset, net or intrabank liability, net in the table above.
Non-GAAP Financial Measures
The Company uses certain non-GAAP financial measures to provide meaningful supplemental information regarding the Company’s operational performance and to enhance investors�� overall understanding of such financial performance.
However, these non-GAAP financial measures are supplemental and are not a substitute for an analysis based on GAAP measures. As other companies may use different calculations for these adjusted measures, this presentation may not be comparable to other similarly titled adjusted measures reported by other companies.
The following non-GAAP measures are presented to illustrate the impact of BaaS loan expense on net loan income and yield on loans and CCBX loans and the impact of BaaS loan expense on net interest income and net interest margin.
Loan income, net of BaaS loan expense, divided by average loans, is a non-GAAP measure that includes the impact BaaS loan expense on loan income and the yield on loans. The most directly comparable GAAP measure is yield on loans.
Net BaaS loan income divided by average CCBX loans is a non-GAAP measure that includes the impact BaaS loan expense on net BaaS loan income and the yield on CCBX loans. The most directly comparable GAAP measure is yield on CCBX loans.
Net interest income, net of BaaS loan expense, is a non-GAAP measure that includes the impact BaaS loan expense on net interest income. The most directly comparable GAAP measure is net interest income.
CCBX net interest margin, net of BaaS loan expense, is a non-GAAP measure that includes the impact of BaaS loan expense on net interest rate margin. The most directly comparable GAAP measure is CCBX net interest margin.
Reconciliations of the GAAP and non-GAAP measures are presented below.
| CCBX | �� | As of and for the Three Months Ended | As of and for the Twelve Months Ended | ||||||||||||||||
| (dollars in thousands; unaudited) | �� | December 31 2024 | �� | September 30 2024 | �� | December 31 2023 | December 31 2024 | �� | December 31 2023 | ||||||||||
| Net BaaS loan income divided by average CCBX loans: | �� | �� | �� | ||||||||||||||||
| CCBX loan yield (GAAP)(1) | �� | �� | 15.28 | % | �� | �� | 17.35 | % | �� | �� | 17.36 | % | �� | 16.89 | % | �� | �� | 16.89 | % |
| Total average CCBX loans receivable | �� | $ | 1,527,178 | �� | �� | $ | 1,552,443 | �� | �� | $ | 1,196,137 | �� | $ | 1,427,571 | �� | �� | $ | 1,210,413 | �� |
| Interest and earned fee income on CCBX loans (GAAP) | �� | �� | 58,671 | �� | �� | �� | 67,692 | �� | �� | �� | 52,327 | �� | �� | 241,134 | �� | �� | �� | 204,458 | �� |
| BaaS loan expense | �� | �� | (24,859 | ) | �� | �� | (32,612 | ) | �� | �� | (24,310 | ) | �� | (111,384 | ) | �� | �� | (86,900 | ) |
| Net BaaS loan income | �� | $ | 33,812 | �� | �� | $ | 35,080 | �� | �� | $ | 28,017 | �� | $ | 129,750 | �� | �� | $ | 117,558 | �� |
| Net BaaS loan income divided by average CCBX loans (1) | �� | �� | 8.81 | % | �� | �� | 8.99 | % | �� | �� | 9.30 | % | �� | 9.09 | % | �� | �� | 9.71 | % |
| CCBX net interest margin, net of BaaS loan expense: | �� | �� | �� | �� | �� | �� | �� | ||||||||||||
| CCBX net interest margin (1) | �� | �� | 8.19 | % | �� | �� | 9.64 | % | �� | �� | 8.62 | % | �� | 8.87 | % | �� | �� | 9.65 | % |
| CCBX earning assets | �� | �� | 2,110,954 | �� | �� | �� | 2,048,918 | �� | �� | �� | 1,765,502 | �� | �� | 1,999,695 | �� | �� | �� | 1,574,334 | �� |
| Net interest income (GAAP) | �� | �� | 43,435 | �� | �� | �� | 49,637 | �� | �� | �� | 38,338 | �� | �� | 177,320 | �� | �� | �� | 151,883 | �� |
| Less: BaaS loan expense | �� | �� | (24,859 | ) | �� | �� | (32,612 | ) | �� | �� | (24,310 | ) | �� | (111,384 | ) | �� | �� | (86,900 | ) |
| Net interest income, net of BaaS��loan expense | �� | $ | 18,576 | �� | �� | $ | 17,025 | �� | �� | $ | 14,028 | �� | $ | 65,936 | �� | �� | $ | 64,983 | �� |
| CCBX net interest margin, net of BaaS loan expense (1) | �� | �� | 3.50 | % | �� | �� | 3.31 | % | �� | �� | 3.15 | % | �� | 3.30 | % | �� | �� | 4.13 | % |
| Consolidated | �� | As of and for the Three Months Ended | As of and for the Twelve Months Ended | ||||||||||||||||
| (dollars in thousands; unaudited) | �� | December 31 2024 | �� | September 30 2024 | �� | December 31 2023 | December 31 2024 | �� | December 31 2023 | ||||||||||
| Net interest margin, net of BaaS loan expense: | �� | �� | �� | �� | �� | �� | �� | ||||||||||||
| Net interest margin (1) | �� | �� | 6.65 | % | �� | �� | 7.41 | % | �� | �� | 6.61 | % | �� | 6.99 | % | �� | �� | 7.10 | % |
| Earning assets | �� | �� | 3,980,078 | �� | �� | �� | 3,875,911 | �� | �� | �� | 3,581,772 | �� | �� | 3,802,275 | �� | �� | �� | 3,364,406 | �� |
| Net interest income (GAAP) | �� | �� | 66,516 | �� | �� | �� | 72,187 | �� | �� | �� | 59,657 | �� | �� | 265,876 | �� | �� | �� | 238,727 | �� |
| Less: BaaS loan expense | �� | �� | (24,859 | ) | �� | �� | (32,612 | ) | �� | �� | (24,310 | ) | �� | (111,384 | ) | �� | �� | (86,900 | ) |
| Net interest income, net of BaaS loan expense | �� | $ | 41,657 | �� | �� | $ | 39,575 | �� | �� | $ | 35,347 | �� | $ | 154,492 | �� | �� | $ | 151,827 | �� |
| Net interest margin, net of BaaS loan expense (1) | �� | �� | 4.16 | % | �� | �� | 4.06 | % | �� | �� | 3.92 | % | �� | 4.06 | % | �� | �� | 4.51 | % |
| Loan income net of BaaS loan expense divided by average loans: | �� | �� | �� | �� | �� | ||||||||||||||
| Loan yield (GAAP)(1) | �� | �� | 10.44 | % | �� | �� | 11.43 | % | �� | �� | 10.71 | % | �� | 10.99 | % | �� | �� | 10.60 | % |
| Total average loans receivable | �� | $ | 3,419,476 | �� | �� | $ | 3,464,871 | �� | �� | $ | 3,007,289 | �� | $ | 3,320,582 | �� | �� | $ | 2,936,908 | �� |
| Interest and earned fee income on loans (GAAP) | �� | �� | 89,714 | �� | �� | �� | 99,590 | �� | �� | �� | 81,159 | �� | �� | 364,869 | �� | �� | �� | 311,441 | �� |
| BaaS loan expense | �� | �� | (24,859 | ) | �� | �� | (32,612 | ) | �� | �� | (24,310 | ) | �� | (111,384 | ) | �� | �� | (86,900 | ) |
| Net loan income | �� | $ | 64,855 | �� | �� | $ | 66,978 | �� | �� | $ | 56,849 | �� | $ | 253,485 | �� | �� | $ | 224,541 | �� |
| Loan income, net of BaaS loan expense, divided by average loans (1) | �� | �� | 7.55 | % | �� | �� | 7.69 | % | �� | �� | 7.50 | % | �� | 7.63 | % | �� | �� | 7.65 | % |
(1) Annualized calculations for periods presented.
The following non-GAAP measure is presented to illustrate the impact of BaaS loan expense, BaaS fraud expense and reimbursement of expenses (BaaS) on noninterest expense. The most comparable GAAP measure is noninterest expense.
| �� | �� | As of and for the Three Months Ended | |||||||
| (dollars in thousands, unaudited) | �� | December 31, 2024 | �� | September 30, 2024 | �� | December 31, 2023 | |||
| Noninterest expense, net of reimbursement of expenses (BaaS) | |||||||||
| Noninterest expense (GAAP) | �� | $ | 64,206 | �� | $ | 65,616 | �� | $ | 51,703 |
| Less: BaaS loan expense | �� | �� | 24,859 | �� | �� | 32,612 | �� | �� | 24,310 |
| Less: BaaS fraud expense | �� | �� | 5,043 | �� | �� | 2,084 | �� | �� | 779 |
| Less: Reimbursement of expenses | �� | �� | 3,468 | �� | �� | 1,843 | �� | �� | 1,076 |
| Noninterest expense, net of BaaS loan expense, BaaS fraud expense��and reimbursement of expenses | �� | $ | 30,836 | �� | $ | 29,077 | �� | $ | 25,538 |
APPENDIX A -
As of December��31, 2024
Industry Concentration
We have a diversified loan portfolio, representing a wide variety of industries. Our major categories of loans are commercial real estate, consumer and other loans, residential real estate, commercial and industrial, and construction, land and land development loans. Together they represent
Commercial real estate loans represent the largest segment of our loans, comprising
The following table summarizes our loan commitment by industry for our commercial real estate portfolio as of December��31, 2024:
| (dollars in thousands; unaudited) | �� | Outstanding Balance | �� | Available Loan Commitments | �� | Total Outstanding Balance & Available Commitment | �� | % of Total Loans (Outstanding Balance & Available Commitment) | �� | Average Loan Balance | �� | Number of Loans | |||||
| Apartments | �� | $ | 405,561 | �� | $ | 4,953 | �� | $ | 410,514 | �� | 7.5 | % | �� | $ | 3,937 | �� | 103 |
| Hotel/Motel | �� | �� | 154,691 | �� | �� | 68 | �� | �� | 154,759 | �� | 2.8 | �� | �� | �� | 6,726 | �� | 23 |
| Convenience Store | �� | �� | 139,735 | �� | �� | 575 | �� | �� | 140,310 | �� | 2.6 | �� | �� | �� | 2,329 | �� | 60 |
| Office | �� | �� | 122,897 | �� | �� | 7,687 | �� | �� | 130,584 | �� | 2.4 | �� | �� | �� | 1,366 | �� | 90 |
| Retail | �� | �� | 103,312 | �� | �� | 414 | �� | �� | 103,726 | �� | 1.9 | �� | �� | �� | 993 | �� | 104 |
| Warehouse | �� | �� | 103,130 | �� | �� | �� | �� | �� | 103,130 | �� | 1.9 | �� | �� | �� | 1,748 | �� | 59 |
| Mixed use | �� | �� | 91,607 | �� | �� | 5,365 | �� | �� | 96,972 | �� | 1.8 | �� | �� | �� | 1,160 | �� | 79 |
| Mini Storage | �� | �� | 80,837 | �� | �� | 10,183 | �� | �� | 91,020 | �� | 1.7 | �� | �� | �� | 3,674 | �� | 22 |
| Strip Mall | �� | �� | 43,894 | �� | �� | �� | �� | �� | 43,894 | �� | 0.8 | �� | �� | �� | 6,271 | �� | 7 |
| Manufacturing | �� | �� | 37,617 | �� | �� | 1,200 | �� | �� | 38,817 | �� | 0.7 | �� | �� | �� | 1,297 | �� | 29 |
| Groups < | �� | �� | 91,520 | �� | �� | 3,777 | �� | �� | 95,297 | �� | 1.7 | �� | �� | �� | 1,173 | �� | 78 |
| Total | �� | $ | 1,374,801 | �� | $ | 34,222 | �� | $ | 1,409,023 | �� | 25.8 | % | �� | $ | 2,102 | �� | 654 |
| �� | �� | �� | �� | �� | �� | �� | �� | �� | �� | �� | �� | �� | �� | �� | �� | �� | �� |
Consumer loans comprise
The following table summarizes our loan commitment by industry for our consumer and other loan portfolio as of December��31, 2024:
| (dollars in thousands; unaudited) | �� | Outstanding Balance | �� | Available Loan Commitments (1) | �� | Total Outstanding Balance & Available Commitment (1) | �� | % of Total ��Loans (Outstanding Balance & Available Commitment) | �� | Average Loan Balance | �� | Number of Loans | |||||
| CCBX consumer loans | |||||||||||||||||
| Credit cards | �� | $ | 528,554 | �� | $ | 717,198 | �� | $ | 1,245,752 | �� | 22.8 | % | �� | $ | 1.8 | �� | 301,799 |
| Installment loans | �� | �� | 656,797 | �� | �� | 15,806 | �� | �� | 672,603 | �� | 12.3 | �� | �� | �� | 1.0 | �� | 690,596 |
| Lines of credit | �� | �� | 722 | �� | �� | 1 | �� | �� | 723 | �� | 0.0 | �� | �� | �� | 1.4 | �� | 524 |
| Other loans | �� | �� | 7,261 | �� | �� | �� | �� | �� | 7,261 | �� | 0.1 | �� | �� | �� | �� | �� | 163,026 |
| Community bank consumer loans | |||||||||||||||||
| Installment loans | �� | �� | 1,917 | �� | �� | 2 | �� | �� | 1,919 | �� | 0.1 | �� | �� | �� | 68.5 | �� | 28 |
| Lines of credit | �� | �� | 181 | �� | �� | 344 | �� | �� | 525 | �� | 0.0 | �� | �� | �� | 5.7 | �� | 32 |
| Other loans | �� | �� | 11,444 | �� | �� | 2,400 | �� | �� | 13,844 | �� | 0.3 | �� | �� | �� | 30.6 | �� | 374 |
| Total | �� | $ | 1,206,876 | �� | $ | 735,751 | �� | $ | 1,942,627 | �� | 35.6 | % | �� | $ | 1.0 | �� | 1,156,379 |
(1)����Total exposure on CCBX loans is subject to CCBX partner/portfolio maximum limits.
Residential real estate loans comprise
The following table summarizes our loan commitment by industry for our residential real estate loan portfolio as of December��31, 2024:
| (dollars in thousands; unaudited) | �� | Outstanding Balance | �� | Available Loan Commitments (1) | �� | Total Outstanding Balance & Available Commitment (1) | �� | % of Total�� Loans (Outstanding Balance & Available Commitment) | �� | Average Loan Balance | �� | Number of Loans | |||||
| CCBX residential real estate loans | |||||||||||||||||
| Home equity line of credit | �� | $ | 267,707 | �� | $ | 453,369 | �� | $ | 721,076 | �� | 13.2 | % | �� | $ | 27 | �� | 10,092 |
| Community bank residential real estate loans | |||||||||||||||||
| Closed end, secured by first liens | �� | �� | 165,433 | �� | �� | 2,080 | �� | �� | 167,513 | �� | 3.1 | �� | �� | �� | 537 | �� | 308 |
| Home equity line of credit | �� | �� | 25,506 | �� | �� | 43,102 | �� | �� | 68,608 | �� | 1.3 | �� | �� | �� | 109 | �� | 234 |
| Closed end, second liens | �� | �� | 11,125 | �� | �� | 965 | �� | �� | 12,090 | �� | 0.2 | �� | �� | �� | 371 | �� | 30 |
| Total | �� | $ | 469,771 | �� | $ | 499,516 | �� | $ | 969,287 | �� | 17.8 | % | �� | $ | 44 | �� | 10,664 |
(1)��Total exposure on CCBX loans is subject to CCBX partner/portfolio maximum limits.
Commercial and industrial loans comprise
The following table summarizes our loan commitment by industry for our commercial and industrial loan portfolio as of December��31, 2024:
| (dollars in thousands; unaudited) | �� | Outstanding Balance | �� | Available Loan Commitments (1) | �� | Total Outstanding Balance & Available Commitment (1) | �� | % of Total Loans (Outstanding Balance & Available Commitment) | �� | Average Loan Balance | �� | Number of Loans | |||||
| Consolidated C&I loans | |||||||||||||||||
| Capital Call Lines | �� | $ | 109,017 | �� | $ | 550,948 | �� | $ | 659,965 | �� | 12.1 | % | �� | $ | 808 | �� | 135 |
| Construction/Contractor Services | �� | �� | 24,367 | �� | �� | 36,343 | �� | �� | 60,710 | �� | 1.1 | �� | �� | �� | 121 | �� | 202 |
| Financial Institutions | �� | �� | 48,648 | �� | �� | �� | �� | �� | 48,648 | �� | 0.9 | �� | �� | �� | 4,054 | �� | 12 |
| Retail | �� | �� | 28,533 | �� | �� | 5,664 | �� | �� | 34,197 | �� | 0.6 | �� | �� | �� | 14 | �� | 2,052 |
| Manufacturing | �� | �� | 5,604 | �� | �� | 4,581 | �� | �� | 10,185 | �� | 0.2 | �� | �� | �� | 147 | �� | 38 |
| Medical / Dental / Other Care | �� | �� | 7,074 | �� | �� | 2,641 | �� | �� | 9,715 | �� | 0.2 | �� | �� | �� | 544 | �� | 13 |
| Groups < | �� | �� | 70,130 | �� | �� | 45,360 | �� | �� | 115,490 | �� | 2.1 | �� | �� | �� | 55 | �� | 1,275 |
| Total | �� | $ | 293,373 | �� | $ | 645,537 | �� | $ | 938,910 | �� | 17.2 | % | �� | $ | 79 | �� | 3,727 |
(1)����Total exposure on CCBX loans is subject to CCBX partner/portfolio maximum limits.
Construction, land and land development loans comprise
The following table details our loan commitment for our construction, land and land development portfolio as of December��31, 2024:
| (dollars in thousands; unaudited) | �� | Outstanding Balance | �� | Available Loan Commitments | �� | Total Outstanding Balance & Available Commitment | �� | % of Total Loans (Outstanding Balance & Available Commitment) | �� | Average Loan Balance | �� | Number of Loans | |||||
| Commercial construction | �� | $ | 83,216 | �� | $ | 30,500 | �� | $ | 113,716 | �� | 2.1 | % | �� | $ | 6,935 | �� | 12 |
| Residential construction | �� | �� | 40,940 | �� | �� | 10,873 | �� | �� | 51,813 | �� | 0.9 | �� | �� | �� | 2,408 | �� | 17 |
| Developed land loans | �� | �� | 8,305 | �� | �� | 456 | �� | �� | 8,761 | �� | 0.2 | �� | �� | �� | 489 | �� | 17 |
| Undeveloped land loans | �� | �� | 8,665 | �� | �� | 4,816 | �� | �� | 13,481 | �� | 0.2 | �� | �� | �� | 619 | �� | 14 |
| Land development | �� | �� | 7,072 | �� | �� | 1,157 | �� | �� | 8,229 | �� | 0.2 | �� | �� | �� | 643 | �� | 11 |
| Total | �� | $ | 148,198 | �� | $ | 47,802 | �� | $ | 196,000 | �� | 3.6 | % | �� | $ | 2,087 | �� | 71 |
| �� | �� | �� | �� | �� | �� | �� | �� | �� | �� | �� | �� | �� | �� | �� | �� | �� | �� |
Exposure and risk in our construction, land and land development portfolio is declining compared to previous periods as indicated in the following table:
| �� | �� | Outstanding Balance as of | |||||||||||||
| (dollars in thousands; unaudited) | �� | December 31, 2024 | �� | September 30, 2024 | �� | June 30, 2024 | �� | March 31, 2024 | �� | December 31, 2023 | |||||
| Commercial construction | �� | $ | 83,216 | �� | $ | 97,792 | �� | $ | 110,372 | �� | $ | 102,099 | �� | $ | 81,489 |
| Residential construction | �� | �� | 40,940 | �� | �� | 35,822 | �� | �� | 34,652 | �� | �� | 28,751 | �� | �� | 34,213 |
| Undeveloped land loans | �� | �� | 8,665 | �� | �� | 8,606 | �� | �� | 8,372 | �� | �� | 8,190 | �� | �� | 7,890 |
| Developed land loans | �� | �� | 8,305 | �� | �� | 14,863 | �� | �� | 13,954 | �� | �� | 14,307 | �� | �� | 20,515 |
| Land development | �� | �� | 7,072 | �� | �� | 5,968 | �� | �� | 5,714 | �� | �� | 7,515 | �� | �� | 12,993 |
| Total | �� | $ | 148,198 | �� | $ | 163,051 | �� | $ | 173,064 | �� | $ | 160,862 | �� | $ | 157,100 |
| �� | �� | �� | �� | �� | �� | �� | �� | �� | �� | �� | �� | �� | �� | �� | �� |
Commitments to extend credit total
The following table presents outstanding commitments to extend credit as of December��31, 2024:
| Consolidated | �� | �� | |
| (dollars in thousands; unaudited) | �� | As of December 31, 2024 | |
| Commitments to extend credit: | �� | �� | |
| Commercial and industrial loans | �� | $ | 94,589 |
| Commercial and industrial loans - capital call lines | �� | �� | 550,948 |
| Construction �� commercial real estate loans | �� | �� | 36,873 |
| Construction �� residential real estate loans | �� | �� | 10,929 |
| Residential real estate loans | �� | �� | 499,516 |
| Commercial real estate loans | �� | �� | 34,222 |
| Credit cards | �� | �� | 717,198 |
| Consumer and other loans | �� | �� | 18,553 |
| Total commitments to extend credit | �� | $ | 1,962,828 |
| �� | �� | �� | �� |
We have individual CCBX partner portfolio limits with our each of our partners to manage loan concentration risk, liquidity risk, and counter-party partner risk. For example, as of December��31, 2024, capital call lines outstanding balance totaled
See the table below for CCBX portfolio maximums and related available commitments:
| CCBX | �� | �� | �� | �� | �� | �� | �� | �� | ||||||
| (dollars in thousands; unaudited) | �� | Balance | �� | Percent of CCBX loans receivable | Available Commitments (1) | �� | Maximum Portfolio Size | Cash Reserve/Pledge Account Amount (2) | ||||||
| Commercial and industrial loans: | �� | �� | �� | �� | �� | �� | ||||||||
| Capital call lines | �� | $ | 109,017 | �� | �� | 6.8 | % | $ | 550,948 | �� | $ | 350,000 | $ | �� |
| All other commercial & industrial loans | �� | �� | 33,961 | �� | �� | 2.1 | �� | �� | 19,104 | �� | �� | 480,000 | �� | 834 |
| AG���˹ٷ� estate loans: | �� | �� | �� | �� | �� | �� | �� | �� | ||||||
| Home equity lines of credit (3) | �� | �� | 267,707 | �� | �� | 16.7 | �� | �� | 453,369 | �� | �� | 375,000 | �� | 36,241 |
| Consumer and other loans: | �� | �� | �� | �� | �� | �� | ||||||||
| Credit cards - cash secured | �� | �� | 211 | �� | �� | �� | �� | �� | �� | �� | �� | �� | ||
| Credit cards - unsecured | �� | �� | 528,343 | �� | �� | �� | �� | 717,198 | �� | �� | �� | 26,742 | ||
| Credit cards - total | �� | �� | 528,554 | �� | �� | 33.0 | �� | �� | 717,198 | �� | �� | 807,484 | �� | 26,742 |
| Installment loans - cash secured | �� | �� | 127,014 | �� | �� | �� | �� | 15,806 | �� | �� | �� | �� | ||
| Installment loans - unsecured | �� | �� | 529,783 | �� | �� | �� | �� | �� | �� | �� | �� | 5,332 | ||
| Installment loans - total | �� | �� | 656,797 | �� | �� | 40.9 | �� | �� | 15,806 | �� | �� | 1,787,118 | �� | 5,332 |
| Other consumer and other loans | �� | �� | 7,983 | �� | �� | 0.5 | �� | �� | 1 | �� | �� | 5,398 | �� | 196 |
| Gross CCBX loans receivable | �� | �� | 1,604,019 | �� | �� | 100.0 | % | �� | 1,756,426 | �� | �� | 3,805,000 | $ | 69,345 |
| Net deferred origination fees | �� | �� | (442 | ) | �� | �� | �� | �� | �� | �� | ||||
| Loans receivable | �� | $ | 1,603,577 | �� | �� | �� | �� | �� | �� | �� | ||||
(1) Remaining commitment available, net of outstanding balance.
(2) Balances are as of January��8, 2025.
(3) These home equity lines of credit are secured by residential real estate and are accessed by using a credit card, but are classified as 1-4 family residential properties per regulatory guidelines.
APPENDIX B -
As of December��31, 2024
CCBX �� BaaS Reporting Information
During the quarter ended December��31, 2024,
The Bank records contractual interest earned from the borrower on CCBX partner loans in interest income, adjusted for origination costs which are paid or payable to the CCBX partner. BaaS loan expense represents the amount paid or payable to partners for credit and fraud enhancements and originating & servicing CCBX loans. To determine net revenue (Net BaaS loan income) earned from CCBX loan relationships, the Bank takes BaaS loan interest income and deducts BaaS loan expense to arrive at Net BaaS loan income (A reconciliation of the non-GAAP measures are set forth in the preceding section of this earnings release.) which can be compared to interest income on the Company’s community bank loans.
The following table illustrates how CCBX partner loan income and expenses are recorded in the financial statements:
| Loan income and related loan expense | �� | Three Months Ended | ||||||||||
| (dollars in thousands; unaudited) | �� | December 31, 2024 | �� | September 30, 2024 | �� | December 31, 2023 | ||||||
| Yield on loans (1) | �� | �� | 15.28 | % | �� | �� | 17.35 | % | �� | �� | 17.36 | % |
| BaaS loan interest income | �� | $ | 58,671 | �� | �� | $ | 67,692 | �� | �� | $ | 52,327 | �� |
| Less: BaaS loan expense | �� | �� | 24,859 | �� | �� | �� | 32,612 | �� | �� | �� | 24,310 | �� |
| Net BaaS loan income (2) | �� | $ | 33,812 | �� | �� | $ | 35,080 | �� | �� | $ | 28,017 | �� |
| Net BaaS loan income divided by average BaaS loans (1)(2) | �� | �� | 8.81 | % | �� | �� | 8.99 | % | �� | �� | 9.30 | % |
(1) Annualized calculation for quarterly periods shown.
(2) A reconciliation of the non-GAAP measures are set forth in the preceding section of this earnings release.
A decrease in average CCBX loans receivable resulted in decreased interest income on CCBX loans during the quarter ended December��31, 2024 compared to the quarter ended September��30, 2024. The decrease in average CCBX loans receivable was primarily due to loan sales in the CCBX loan portfolio as part of our strategy to optimize the CCBX loan portfolio and strengthen our balance sheet through originating higher quality new loans and enhanced credit standards. These higher quality loans also have lower stated rates and expected losses. As a result, our yield on loans and our BaaS loan expense decrease by similar amounts. We continue to reposition ourselves by managing CCBX credit and concentration levels in an effort to optimize our loan portfolio and generate off balance sheet fee income. Growth in CCBX loans and deposits has resulted in increases in interest income and expense for the quarter ended December��31, 2024 compared to the quarter ended December��31, 2023.
The following tables are a summary of the interest components, direct fees, and expenses of BaaS for the periods indicated and are not inclusive of all income and expense related to BaaS.
| Interest income | �� | Three Months Ended | |||||||
| (dollars in thousands; unaudited) | �� | December 31, 2024 | �� | September 30, 2024 | �� | December 31, 2023 | |||
| Loan interest income | �� | $ | 58,671 | �� | $ | 67,692 | �� | $ | 52,327 |
| Total BaaS interest income | �� | $ | 58,671 | �� | $ | 67,692 | �� | $ | 52,327 |
| Interest expense | �� | Three Months Ended | |||||||
| (dollars in thousands; unaudited) | �� | December 31, 2024 | �� | September 30, 2024 | �� | December 31, 2023 | |||
| BaaS interest expense | �� | $ | 22,243 | �� | $ | 24,819 | �� | $ | 21,826 |
| Total BaaS interest expense | �� | $ | 22,243 | �� | $ | 24,819 | �� | $ | 21,826 |
| BaaS income | �� | Three Months Ended | |||||||
| (dollars in thousands; unaudited) | �� | December 31, 2024 | �� | September 30, 2024 | �� | December 31, 2023 | |||
| BaaS program income: | �� | �� | �� | �� | �� | �� | |||
| Servicing and other BaaS fees | �� | $ | 1,043 | �� | $ | 1,044 | �� | $ | 1,015 |
| Transaction fees | �� | �� | 1,783 | �� | �� | 1,696 | �� | �� | 1,006 |
| Interchange fees | �� | �� | 1,916 | �� | �� | 1,853 | �� | �� | 1,272 |
| Reimbursement of expenses | �� | �� | 3,468 | �� | �� | 1,843 | �� | �� | 1,076 |
| BaaS program income | �� | �� | 8,210 | �� | �� | 6,436 | �� | �� | 4,369 |
| BaaS indemnification income: | �� | �� | �� | �� | �� | �� | |||
| BaaS credit enhancements | �� | �� | 62,097 | �� | �� | 70,108 | �� | �� | 58,449 |
| BaaS fraud enhancements | �� | �� | 5,043 | �� | �� | 2,084 | �� | �� | 779 |
| BaaS indemnification income | �� | �� | 67,140 | �� | �� | 72,192 | �� | �� | 59,228 |
| Total noninterest BaaS income | �� | $ | 75,350 | �� | $ | 78,628 | �� | $ | 63,597 |
Servicing and other BaaS fees decreased
| BaaS loan and fraud expense: | �� | Three Months Ended | |||||||
| (dollars in thousands; unaudited) | �� | December 31, 2024 | �� | September 30, 2024 | �� | December 31, 2023 | |||
| BaaS loan expense | �� | $ | 24,859 | �� | $ | 32,612 | �� | $ | 24,310 |
| BaaS fraud expense | �� | �� | 5,043 | �� | �� | 2,084 | �� | �� | 779 |
| Total BaaS loan and fraud expense | �� | $ | 29,902 | �� | $ | 34,696 | �� | $ | 25,089 |
A photo accompanying this announcement is available at
